Please review the site Rules, Terms of Service, and Privacy Policy at your convenience. Rules, TOS, Privacy
Get familiar with the reaction system: Introducing the Reaction System

How to interpret transfer function

Just wondering how the data in the transfer function box in PCD is used in x-over design? Are you looking for certain response curves? Just trying to learn a bit more about pcd.
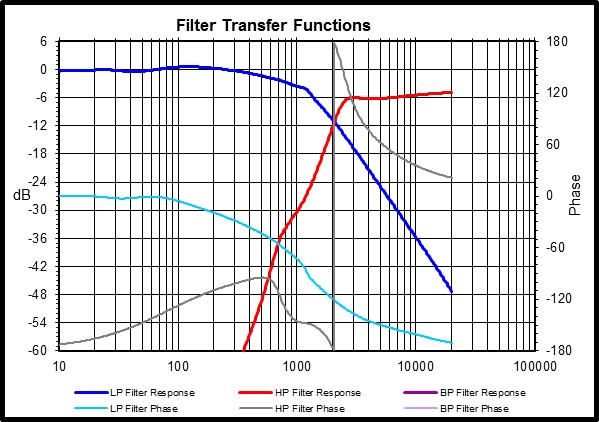
Comments

  • This is the frequency response of your filter, period. If you were to take an electrical frequency sweep at the output of your filter, this is the frequency response you should measure. This response curve is what is applied to your speaker's raw frequency response to determine the final acoustic response.


    squamishdroc
    I'm not deaf, I'm just not listening.
  • I use the filter response to understand how to shape the driver's frequency response.  Looking above I see minor inductor bump at 120 Hz.  The rising filter response at 20K might be used to help a sagging tweeters HF response.  I also use the filter response to help target a notch filter's impact on the driver's FR. 

    The filter response helps me find wasted parts or parts that provide little impact.
    rjj45squamishdrocJasonPkennyk
     John H, btw forum has decided I don't get emails
  • you can use it to see the slope and the frequency where you are crossing over and as you change the values in PCD, yo u see the slope change or move up or down the frequency. It gets more interesting as you add in a notch filter, yo ucan see where the notch is centered and how broad or narrow it is. Combined with the FR of the driver you can see the effect of the changes of the values and the filter has on the driver response. The transfer function also lets you see the effect of BSC as you should have a hump around the 800hz (or something depending on your baffle width) and if hump is 6db you have full BSC. in the example above it looks like you have 6db BSC, rising response from 1200 and looks like 6db higher from the tweeter response which i assume is the baseline response, XO is around 2khz (try to keep XO more than 2X it's FS at least)

    then you put together the crossover and verify the theory by measuring again. if everything looks good, then you start fiddle with smaller values for the voicing... 

    Another thing you can do is put in a target filter curve in PCD and try to get your filter transfer function close to it, but it's not necessary that you need to match the textbook curve, but it gives you a general idea
    squamishdroc
Sign In or Register to comment.