Site Links
Howdy, Stranger!
It looks like you're new here. If you want to get involved, click one of these buttons!
Quick Links
Categories
Who's Online (0)
Question about Jeff's BDBS program
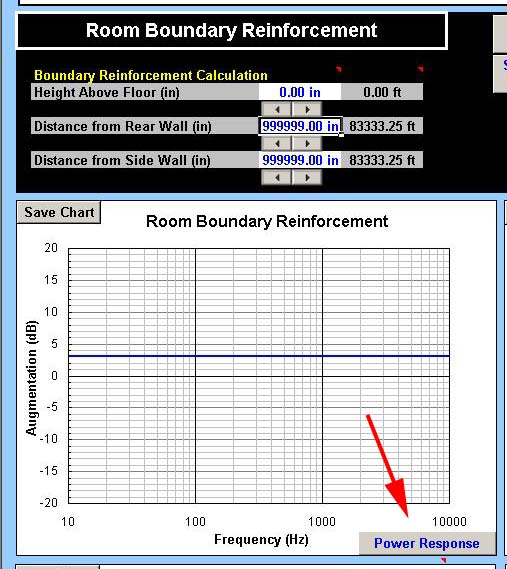
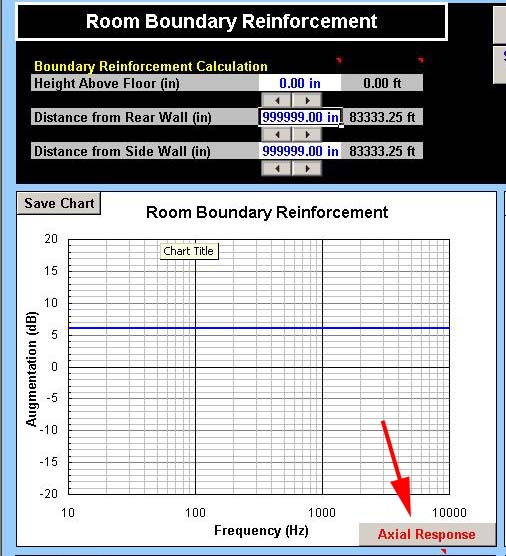
I have a question regarding Jeff Bagby's "Baffle Diffraction and Boundary Simulator" (BDBS) spreadsheet. In the "Room Boundary Reinforcement" quadrant, if you set the distance to the side and rear walls to infinity and then set the floor distance to zero, the gain (or augmentation) at all frequencies is 6dB when the "Power response" button is clicked. This becomes 3dB at all frequencies when the "Axial response" button is clicked. (See screen shots below).


As I understand it, Jeff used the Allison room boundary reinforcement equations to show the average room gain based on the driver's distance to the selected boundary. So, as you increase the driver to boundary distance, room gain decreases as a function of frequency. My question is: Why is the "Axial response" curve offset by 3dB from the "Power response" curve? Would "Power response" be the gain in 2pi space and "Axial response" the gain in 3pi space? The "Axial response" cannot be related to a specific listening or microphone position, because this data is not entered anywhere on the spreadsheet. Does anyone know if Jeff had put together an instructional paper on how to use the BDBS spreadsheet?
The reason that I am asking is because I am attempting to incorporate some type of average floor boundary gain into my VituixCAD models when merging woofer Port+NF+FF+diffraction FRDs. I am finding that changing the woofer to floor distance can make quite a bit of difference in the amount of lower mid-bass (80 to 500Hz) output reaching the listening position.

Comments
Not offset by 3dB, divided by 2.
If you want to include the room, maybe try using real measurement of room average for low frequency portion of merge instead of nearfield? REW pink noise RTA moving mic average, or vector average of many individual measurements.
Thanks, dcibel. I will give this a try and report back with some averages.