Site Links
Howdy, Stranger!
It looks like you're new here. If you want to get involved, click one of these buttons!
Quick Links
Categories
Who's Online (0)
anechoic response, in-room response, and affects on Xover voicing (at the listening location)
A couple of recent posts got me thinking about our voicing of crossovers relative to the out-of-the box (i.e. VituixCAD or Xover sim software, etc. 1st-go actual breadboarded components) as compared our final voiced components Xover, and the ‘room component/affects’.
When I go to build a passive Xover (say for example between mid-woofer to tweeter) I measure the drivers individually @ very, very nearfield to compare vs the drivers' and VituixCAD's frequency curves to see that they are all in the ballpark, and what I’m actually working with. From there my measurements are taken at 30 inches as I ‘build out’ my breadboard Xover, making adjustments to each component up and down slightly and measuring the resulting curves / filter slopes. I initially aim the mic at the center of the driver I’m playing with. Then, after I’ve got the components figured out to get the approximate filter slope on each driver independently, I move the mic to aim towards the center point of the two drivers (maybe a hair above center favoring the tweeter’s propagation toward the anticipated listening spot) and start the slight component changes, and measuring over. This gets me to what I’d expect is the ‘best’ Xover component values without room affects.
Then comes the ‘voicing’. Sit back (a glass of red wine or two) and listen to a few of my favorites. Make a few notes and then measure from the listening location (~ear height aimed at slightly above the mid-point of the mid-woofer and tweeter – even if a 3 way). From here I do another round of component ups and downs, listening and measuring, ending up with a Xover to listen to over the next several days, and then revisit…
What I haven’t done, and hope to do next time around, is to measure the ‘final Xover’ very, very nearfield and compare it to the original ‘out of the box’ Xover. If any of you do this, please post as it will be interesting to see the differences (pre and post voicing).
Why?
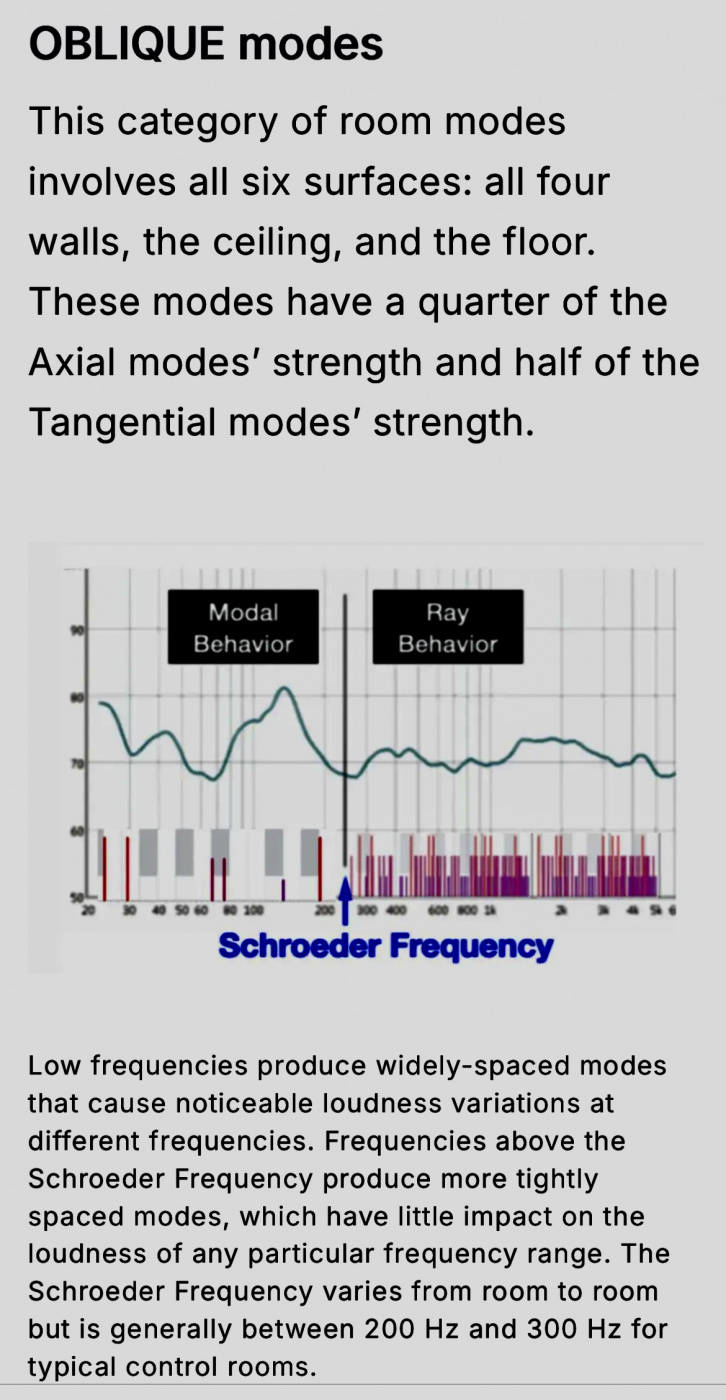
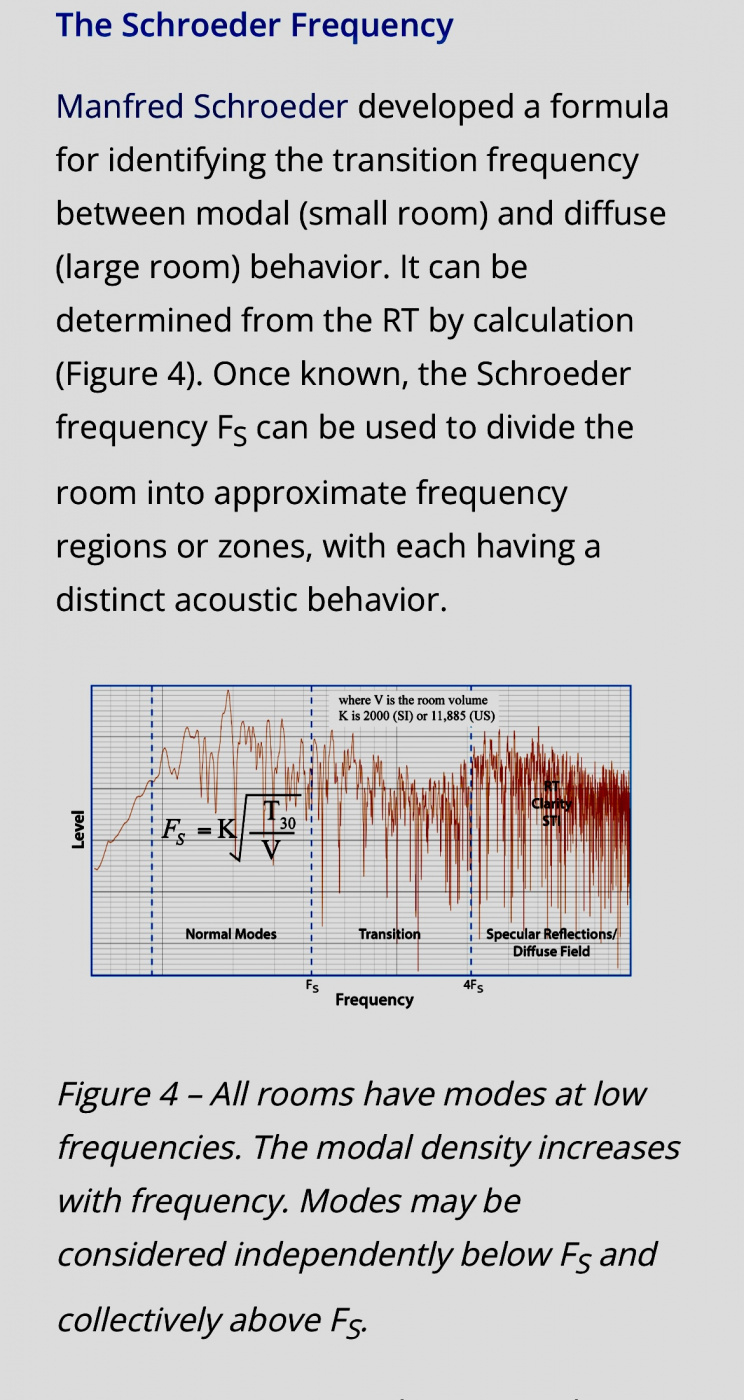
After reading the ‘Heavenly Soundworks’ post, specifically re: Ed’s comment ‘…anechoic response.. a lot different than flat in-room response’ I did some googlin’ to look at room mode affects on speaker frequency response. What I found interesting from a couple of graphs (attached), specifically relative to our voicing of the mid-woofer to tweeter Xover, is the rise in the 1Khz to ~3.5Khz range. Not only is this our most ear-sensitive hearing range where most designed tweeter Xover slopes live, it is also the ~range of the infamous BBC dip. So, I go thinking/wondering when we are ‘voicing’ in-room at the seating position are we not implementing / selecting components that deal with this obvious rise and hence the basis for the BBC dip sound advantage (IMO)? As mentioned, I haven’t done a comparison of the out-of the box vs post voicing @ the driver, but I’ve got to think this negative ‘room affects’ will show up. Maybe those old BBC boys were on to something… When I do a final DSP (I’m using it as an active between woofer and mid/tw, and as an overlay to attenuate room upward bumps) it is not uncommon for me to net-out a broad, and very shallow, BBC dip ~850Hz-ish through 4.5kHz, and age-wise I don’t mind seeing a slight rise from 12.5kHz out through infinity.


Final 2cents; not as much of a bid deal (voicing from our room vs the hotel meeting room) in the upper ranges, but the room nodes in the lower ends can be more affected?

Comments
The frequency response shown in the VituixCAD SPL panel is the simulation at 2m by default (or 2.5m, check the options window). If you measure at 1m your measured SPL will NOT match the sim. If you measure closer than 1m it will differ even more.
Thx, yes.
For me the sim is just the starting point / gets me a starting point at best. It’s the initial @driver slope response vs post voicing comps @driver I’m thinking will show the net voiced room affects.
Have you tried taking a set of 1 meter "spin" measurements and then loading this entire set of polars into VituixCAD? That rise or bulge in the 3 to 5kHz region, as you describe it above, is generally due to a directivity mismatch between tweeter and midrange, in combination with a narrowing directivity of most flat flange type 1 inch dome tweeters above 10kHz. I am finding that this bulging response curve gives the speaker a bright & harsh sound quality that is lacking in "air" at the highest frequencies. So far, almost every time that I have set up a full 360 degree spin model in VituixCAD, I can see this 3-5kHz directivity induced "bulge" staring me in the face. So I am now finding that I either have to use a BBC dip of some type to fix it or I have to find some other way to match the directivity of my tweeter and midrange drivers.
It is long known that a "BBC dip" compensates for the off-axis bloom, especially when using LR topology.
I haven't done a full 360 spin, but have loaded on axis 0, 15, 30, and 45 degree measurements horizontal. I've sort-of concluded, for my simulation starting points (measured at 30in) best to load the averaged of; on-axis, 15 and 30 degree horizontal measurements. After the sim based breadboarded Xover is built and initial component changes measured to get each driver's individual filter slope ~towards targeted, ****I move to measuring both drivers (concurrently) through horizontal and vertical.**** It's always a bit of a compromise of course, but I place emphasis on 15 degrees horizontal and on axis vertical, and then final at my listening location in combo with voicing/ subjective listening.
****What I found of interest to the Oblique Modes / Schroeder Frequency charts (absent of mid-tweeter interactions/ mismatch) was the room induced bloom/bulge in the 1kHz - 3.5kHz range, which presumably would be seen with a full range driver in -room response as well. I've just in the past been more aware of low-end frequency room and floor-bounce affects.****
You really should take dual axis measurements:
0-360 in horizontal plane (0-180 if symmetrical)
and 0-360 in vertical plane every 10 degrees.
A lot of your queries about voicing will be revealed once you see how your crossover adjustments will affect the on axis, listening window, and predicted in-room response, horizontal polar or vertical polars etc…
This one of the most powerful features of VituixCAD2 and highly recommended- by the author of the program.
Instructions available for
ARTA, REW, SoundEasy, Clio…
https://kimmosaunisto.net/