Site Links
Howdy, Stranger!
It looks like you're new here. If you want to get involved, click one of these buttons!
Quick Links
Categories
Who's Online (0)
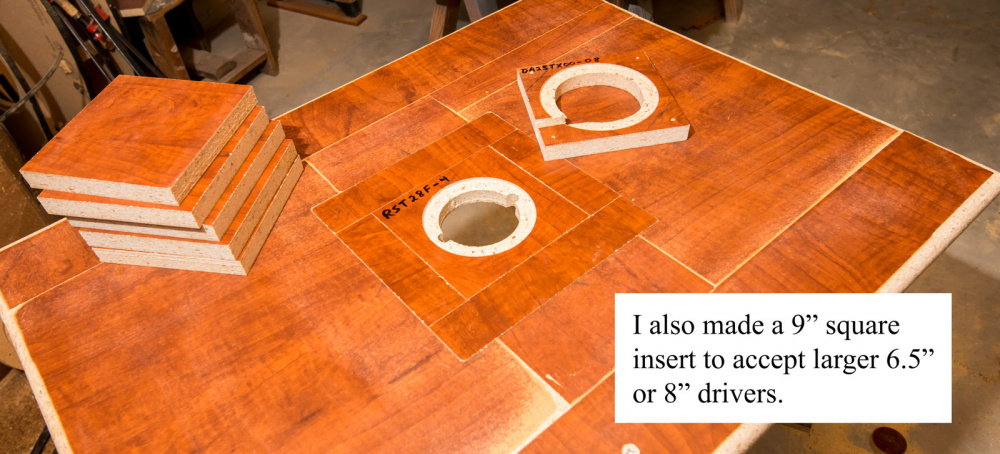
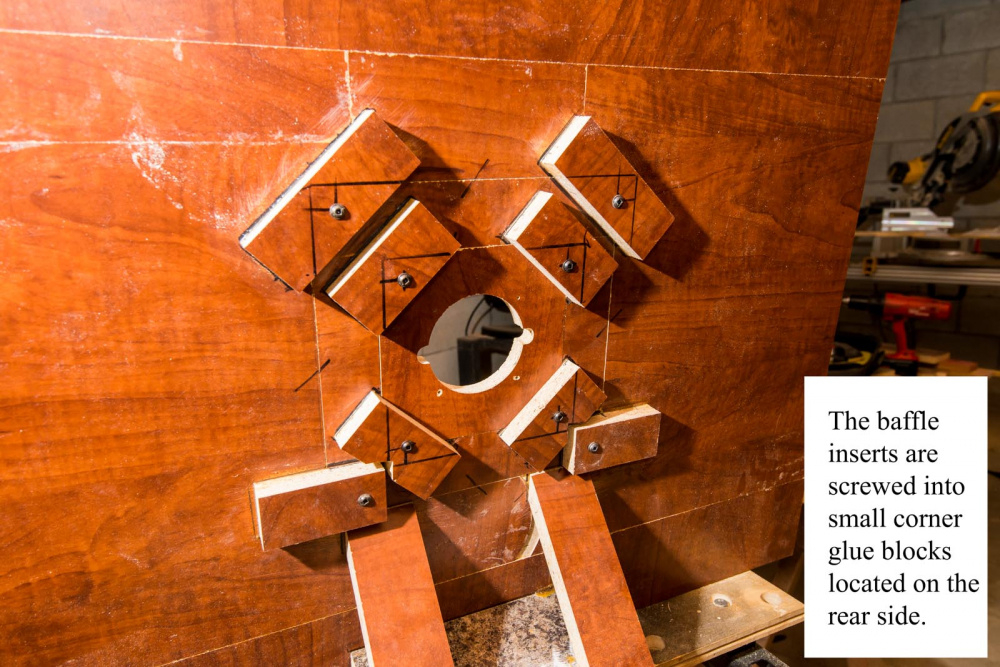
RST28F-4 mod squigglies mounted on 24x30 test baffle

I built a test baffle a while back using left over lumber. I wanted something that would give me a rough idea of how badly my hair-brain-idea baffle board dimensions and round overs were messing things up. Also, I'll post my RST28F mod measurements here as well as other drivers that I have on hand.


Comments
For the first set of tests, I have a pair of good RST28F-4's as well as a pair of defective RST28F-4's with messed up impedance curves. My good pair are completely stock. I did the Ben mod on one of my defective RST28F-4's while the other one still has the original chamber sealed onto the back. On the Ben mod unit, I also removed the grill and plastic insert and filled the area vacated by the grill with a plumbing store o-ring:
Here is a link to the PE thread on how to do the Ben mod:
http://techtalk.parts-express.com/forum/tech-talk-forum/1417345-mwaf-contestants-b-stock-rst28f-4-info
I'll attach the impedance curves first:
And some comparison FR plots:
Comments: The plastic "phase" cover over the dome appears to make a significant difference in measurements. Especially above 10kHz. I put the phase cover back onto my modified tweeter with small dabs of mortite on the 4 legs, and it measures very close to the unmodified good tweeters above 10kHz. This cover also makes a huge difference in the horizontal polar plots. So this plastic cover is much more than a 2nd layer of protection for the dome. Here are the polars:
More comments: The plumbing o-ring makes a very small difference right around 10-12kHz. Probably inaudible.
The Ben mod: on my graphs, you can see a fairly big difference from 500Hz to 2kHz. This is probably due to the change in low frequency performance from the change in stuffing density. Might make a small difference in crossover design. Audible: probably not.
So, are these mods worth the time and effort? Who knows. I would have to build some speakers and listen for a while. The polar plots are significantly different, but I have no idea as which one is the better plot.")
InDIYana Event Website
The phase shields that I snipped out are still in good shape and I'm thinking about gluing them back in position with 4 small dabs of super glue gel. Should work. The screen, however, is hosed.
And now for some HD comparisons. I tested at a moderate power level (85dB at 30 inches) with no protection cap. Notice how the HD ramps up significantly from 300 to 600Hz on the unmodified defective RST28F compared to the Ben mod or the Good unmodified unit. Also, I made an open office spreadsheet showing the comparison percentages and attached it as a jpeg. Interestingly, the distortion is lower at 200Hz for the unmodified defective unit. Probably has something to do with the funny looking impedance curve.
and modded:
and the other unit:
mod drawing:
InDIYana Event Website
Ya, that is really strange. My distortion is very flat in that frequency region while your mod unit dips very low. My mod unit, on the other hand, brings the distortion down significantly BELOW 1K, while yours peaks up below 1K.
Also, my measurements do not appear to roll off as fast below 1K. You mentioned, as I recall, that you used a 70uF series protection cap. I did not use a protection cap. This may account for some of the difference.
I used the original chamber with ultratouch denim replacing that "difficult-to-remove" thin fiberglass pad that was glued to the back of the chamber. I left the original foam plug in the pole piece, but pulled it out a little to allow greater air flow which is similar to what the cotton ball replacement plug does. I got an Fc of about 750 and Qtc of roughly .79 with a single Z peak very similar to the one that you got (the purple curve above). Your Fc, however, was a little higher in the 800's.
I was re-reading the section on HD measurements in OmniMic help and it mentions that you should take HD measurements as close as possible to reduce room reflections as much as possible. Maybe my 30 inch distance was too great. The gating function appears to be turned off during HD measurements, resulting in possible contaminated measurements. Just a thought.
Thanks, that is exactly what I was looking for
InDIYana Event Website