Whoo-Hoo! I discovered what I was doing wrong in Soundeasy. Everything seems to be working now. I hate to admit this, but I was simply hitting the wrong button on Soundeasy's MLS measurement screen. To generate the impedance curve from the impulse response, I was hitting the "IR > SPL" button when I should have been hitting the "IR > Zin" button! I simply could not find the "IR > Zin" button because the bottom 15% or so of the MLS measurement screen is cut off on my laptop and cannot be adjusted to show the bottom part only. My HP laptop has a maximum screen resolution of 1366x768 pixels and this particular screen in SE does not auto scale to fit this format. I tried changing my screen resolution to other settings, but the bottom of the MLS measurement screen was always cut off. Finally, in frustration, I hooked up an external LCD monitor via HDMI and this allowed me to change the screen resolution to 1440x900 pixels. That worked. I can now see and click all the buttons.
Here is Soundeasy's MLS measurement screen showing the impedance calibration with the speaker leads disconnected:
Here is Soundeasy's MSL measurement screen showing the impulse response and impedance curve with the ND90-8 connected:
And here is the TS parameter tab screen showing the added mass overlay and full T/S parameters. They are very close to what I measured previously with DATS V2 and LIMP.
I also opened up the ARTA program and performed the FR1 and FR2 jig loopback tests. They look very similar to dcibel's curves, except the left hand scale is different for some reason.
The loopback FR I showed was with my antique Realistic SA-1000. I explained there that modern equipment should be flatter on the low end as you show. In any case, the point of the exercise is to understand the natural frequency response of your equipment and to see that it is completely compensated for by this 2 channel measurement process.
Today I mounted the Sonarworks mic on the end of a powerPEX 1" diameter tube. I copied this idea from the picture that Wolf posted of Ben measuring the Missing Link speakers.
Visual parts list:
I folded thin strips of UltraTouch denim around the mic cable as I slid it into the tube:
The mic and XLR connector fit the inside diameter (.829" or 21mm) of this tube very well. I secured the mic in place with several turns of blue plastic electrical tape:
In taped a 9 inch long piece of 1/4" x 1" aluminum bar stock to the tube. The bar stock is drilled and tapped 1/4-20 to accept the quick-connect tripod mounting plates that I use.
It took me a while, but I was able to get Soundeasy working with the new SoundWorks mic, calibration file, and ARTA jig.
Here is a photo of my setup. I removed the 1/4" TRS cable that was plugged into the UR22's mic/line input 2 and replaced it with the microphone's XLR connector. Then I flipped the jig's SPL/IMP switch to "SPL". I flipped the UR22's rear panel switch to turn on the red "+48V" phantom light. And finally, I adjusted Mic/line input 2 to about the 3/4 level to match the gain for the REF and SPL channels.
I downloaded and installed the mic's calibration file using SE's Driver Parameter Editor to "repair" and add phase data to the file. The original cal file was 750 lines from 20Hz to 20kHz, so I modified SE's system-wide frequency range in preferences to match this bandwidth. I would have liked to set the bandwidth to 10Hz-50kHz, but the SE help file told me that I had to match these parameters (boo!)
Here is what the calibration file alone looks like. The uncalibrated mic is fairly flat at most frequencies and then rolls off by about 1-3dB or so at the highest frequencies.
For testing, I measured the small 8" two-way speaker that I brought to IowaDIY this past year. The measurement was taken at a distance of 28" on-axis to the tweeter, so I set SE's acoustical distance to 71cm. The distance from mic to floor was 60", so I set the gate to 7.03ms.
Here is what the measurement looks like without the calibration file loaded. Notice how the response peaks up at the higher frequencies.
Finally, here is the same speaker measured with OmniMic, using the same 28" on-axis mic position and 7.03ms gate. With OmniMic, I used the sine sweep, blended mode, and 1/96th smoothing.
Next up, I am going to measure the same speaker with ARTA.
I downloaded and installed the mic's calibration file using SE's Driver Parameter Editor to "repair" and add phase data to the file. The original cal file was 750 lines from 20Hz to 20kHz, so I modified SE's system-wide frequency range in preferences to match this bandwidth. I would have liked to set the bandwidth to 10Hz-50kHz, but the SE help file told me that I had to match these parameters (boo!)
You can use 10-50kHz, but you just have to fill in the gaps with the HBT response. Effectively you can record and operate to 50kHz, but the response is "uncalibrated" beyond 20kHz. I would operate SE to 50kHz with this in mind, as the extra information to show tweeter resonance, etc is nice to have.
I would recommend setting the HBT slope to 0db/oct though for the mic calibration file. This will create a flat line when you fill in to 10Hz and 50kHz, and for the 20Hz-20kHz response it will correct the phase at both ends. If you compare your calibrated/uncalibrated measurements above you can see how the HBT slope has messed with the phase at the frequency extents.
For a little extra information if you ever start using ARTA, the ARTA developer has told me that there is general disagreement on what constitutes minimum phase of a microphone, so ARTA simply doesn't compensate for phase at all, the calibration is amplitude only. He said that if you want to be real particular about phase in the top octave then better to get a mic that is flat to begin with before it's compensated with a calibration. For SE to calculate phase with accuracy you would need some knowledge of what the mic response looks like out of band, which we don't have, so you can assume some slope value or do like I do and assume perfection with 0dB/oct slope. With a 0dB slope your mic calibration phase will remain pretty much the same as the manufacturer provided in the original calibration file, provided the cal was provided with a phase column. If for some reason you had a mic that had a visible slope at the top end, I would simply set the slope of the HBT to match as usual.
If you compare your SoundID mic to your Omnimic and the measurements don't match exactly, decide which mic you trust the most and you can easily generate your own calibration file so that you get pretty much exactly the same response no matter which mic you use. To compare, just save each measurement and use the calculator tool in VituixCAD to overlay them. I would use ungated measurement for the comparison so you don't have differences from gating window type and that "blended" stuff that Omnimic does. Looking at the measurements above, they look pretty close, maybe a little different in the 10kHz range.
To create your own calibration, just take a ungated measurement of a half decent speaker, load the calibration for the mic you trust and measure with the other uncalibrated. Carefully change out the mics to be in the same location and distance from the speaker. With both measurements in hand you can use VituixCAD calculator tool and divide them to create a calibration file.
FWIW the screenshot in the SE manual (under the mic calibration section) suggests for mic calibation to use 0dB slope on the low end, and 8dB/oct slope on the top end, I guess that would be assuming that the high end response will drop off, but that slope is just an assumption, I would still call the response with either method as "uncalibrated" beyond 20kHz.
My OmniMic was originally calibrated by Parts Express and I am still using the calibration file that they gave me. The curves above for my new Soundworks mic and my old OmniMic look fairly close, but, as dcibel suggests, I will need to re-run these measurements without gating and then overlay them into VituixCAD's calculator tool. When Cross Spectrum Labs calibrates a mic, do you know if they measure it from 20Hz to 20kHz only? Or do they go out to 40kHz?
Good point. I'll just use the HBT response to fill in the gap. I just wanted to be able to measure out beyond 20kHz so that I could see the high frequency peaking on ceramic or beryllium dome tweeters.
Thanks for the calibration info. I ran two ungated frequency response comparison curves, using the same loudspeaker, and then overlayed the two curves in VituixCAD. The green curve was made with the calibrated Soundeasy/Soundworks SoundID mic combo. The blue curve was made with my calibrated OmniMic. Both curves were made with the mic tips carefully positioned 60" above the floor and 28" on axis with the tweeter. Ignoring the random noise differences below 100Hz, the curves are virtually identical up to about 2.5kHz. Then from 3-20kHz, they depart in two or three places by about 0.5 to 1dB. Some of this variation might be due to the fact that I simply could not position the microphone tip in "exactly" the same position for the two measurements (very close, but not exact).
So, I've decided to "trust" the new mic and calibration file for future builds. This mic is more than likely more accurate because it has the most recent calibration. My OmniMic is about 7 years old now and it may have drifted slightly out of tolerance over the years.
Bill put the mic right up against the tweeter, near field just like you would for a woofer. You should be able to get a better comparison between the two mics that way.
@4thtry said:
Thanks for the calibration info. I ran two ungated frequency response comparison curves, using the same loudspeaker, and then overlayed the two curves in VituixCAD. The green curve was made with the calibrated Soundeasy/Soundworks SoundID mic combo. The blue curve was made with my calibrated OmniMic. Both curves were made with the mic tips carefully positioned 60" above the floor and 28" on axis with the tweeter. Ignoring the random noise differences below 100Hz, the curves are virtually identical up to about 2.5kHz. Then from 3-20kHz, they depart in two or three places by about 0.5 to 1dB. Some of this variation might be due to the fact that I simply could not position the microphone tip in "exactly" the same position for the two measurements (very close, but not exact).
So, I've decided to "trust" the new mic and calibration file for future builds. This mic is more than likely more accurate because it has the most recent calibration. My OmniMic is about 7 years old now and it may have drifted slightly out of tolerance over the years.
Close enough. Just for some calculator tool fun, you have the option there to apply smoothing to get rid of some of that "noise". Also try selecting "divide A/B", then look around 0dB level, you should see a graph showing just the difference between the two measurements.
Ya, I tried the "divide A/B" function with additional smoothing and that works well to show the differences. I also tried moving the mic closer for the test, from 28" on axis to about 7" on-axis and that also helped to smooth out the noise at higher frequencies, even when using 1/48th smoothing. When I took measurements at a distance of 7" on-axis, the two mics are virtually idential all the way up to 8kHz. Then from about 9-17kHz, OmniMic measurements are about 1dB higher than the Sonarworks SoundID mic. Above 17kHz, the two mics are pretty much the same again.
Nick, I tried to put the mic right up against the tweeter, but that did not seem to be working. This is the Dayton RST28F-4 with the metal protective screen and plastic phase cap over the dome. When I got close with the mic, the response started bulging up at high frequencies, so I backed off to about 7 inches.
Today I was able to get the demo version of ARTA working with the jig and new mic. So, I'd like to post a few screen shots to show how I set things up. I did the best I could based on my reading of ARTA's help manual instructions. I measured the same speaker as before, with the mic tip 28" on axis with the tweeter and 60" above the floor.
Here is the ungated frequency response and phase screen, using a 2.125ms time of flight delay to eliminate excess phase:
Here is ARTA's cross correlation screen, showing how the 2.125ms delay was calculated:
Here is the frequency response measurement setup screen, showing the 2.125ms delay as well. This delay relates to the time it takes for the impulse to travel from the tweeter flange to the tip of the mic:
Here is the gated frequency response and phase, using a 7.03ms gate and 1/24th octave smoothing:
Here is the impulse response parameter screen, showing the 7.03ms gate and a few other parameters that I do not understand. I don't know what the gate 2 of 200ms means or where the 3.276 delay estimate value came from.
Finally, here is the impulse response screen, showing the gate of 7.03ms and the pre-delay of 3.276ms.
The "cross-correlation" in ARTA is basically just measuring the distance between the peak of the reference impulse to the measurement impulse. It is accurate to within 1 sample time, so it's close but not perfect. Depending on sample rate, using these delay values directly can create a fair bit of phase error.
At 48kHz, 1 sample error represents a +/- 38 degree phase shift at 5kHz
At 96kHz, 1 sample error represents a +/- 18 degree phase shift at 5kHz
At 192kHz, 1 sample error represents a +/- 9 degree phase shift at 5kHz
The good news is that determination of delay is not necessary at all for gathering accurate measurement data for loudspeaker design. All that really matters is that you lock the FFT window start position, and keep a constant distance between mic and speaker baffle for all measurements. By doing so, all delay will be inherently captured in the measured phase. Min phase? Forget about it. 3 measurement delay determination process? Forget about it.
The two gate times you see in the Impulse response parameters screen only apply to the "dual gate" frequency response. You can think of this as similar to the blended response in Omnimic, where Omnimic blends the gated measurement with an ungated response, here you have the same thing but with some control over the gate of the lower frequencies. It's not a feature I've ever really used for gathering information for loudspeaker design to be honest, it can be useful for some in-room measurements though.
For standard single gate frequency response, the gate time is determined by setting the cursors on the impulse response window, left click and right click. shift + cursor for fine adjustment 1 sample at a time. Gate width will be shown at the bottom.
Gate of 7.03ms, well you've right clicked at some point to set the window end location, at the bottom of the screen you can see it set at sample 675 and 7.031ms. You haven't left clicked to set the start time, so the start is t=0. Simply put, 675 samples at 96kHz is 7.03ms.
The problem with t=0 in ARTA is that it isn't where the reference signal starts. The reference signal will always be at sample 300, use the "home" key on your keyboard to set the cursor there. If you want to get quick and dirty time of flight determination, measure from sample 300 to your measured impulse, not by looking directly at the time scale on the impulse chart.
Pre-delay is used to add excess delay prior to the FFT start location, you can leave it set to zero for the most part.
Not exactly. I mean you _can _do it like that, but I wouldn't. You don't need to place the start of the FFT at sample 300, just place anywhere close to but before the impulse. I always hit the gain and zoom buttons on the right hand side too. Crank up the gain so the reflections in the impulse are clear, otherwise the gate length is a bit of guesswork.
With the start of the FFT at 300 you are including the entire time of flight to the driver, which is a lot of excess phase making the phase plot real hard to look at with so many cycles.
The kicker with the start of the FFT gate, is that ARTA doesn't include any "front gate" so it won't capture the frequency response properly if you place the start of the gate in front of the impulse. What this means is that when you set your start gate for measuring all drivers in a speaker, you should use the driver closest to you to set the FFT start location to ensure all measurements fall in the gate. In most cases that would be the tweeter, but not always if you are doing a horn design for example.
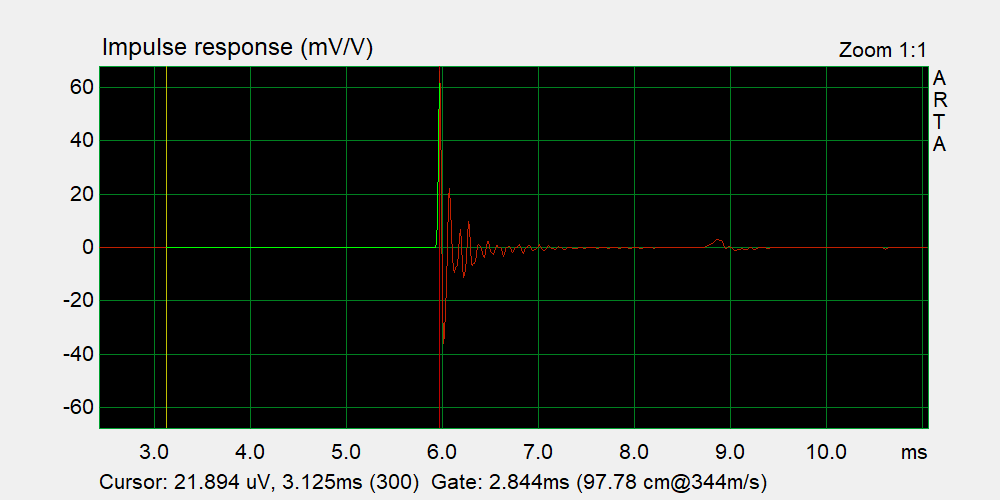
What I meant for using sample 300 for simple time of flight measurement, is that you can see above that sample 300 is at time 3.125ms. If you then hit the "max" button to set the cursor at the peak of the impulse, it will tell you a time location, subtract 3.125ms for the time of flight from driver to mic +/- 1 sample time. You can use left and right click and use the gate length at the bottom to do the same thing. It should be roughly the same time as what that "cross correlation" window told you.
If you purchase a ARTA license so the impulse response files can be saved, all this processing can be done in bulk for all your measurements in VituixCAD, and with better FFT processing features such as that front window I mentioned. All that really needs to be done in ARTA is just record, save file, repeat.
Thanks again for all the great tips. I think I am finally beginning to understand how this process actually works. The closer you put the start curser to the beginning of the impulse, the less phase wrapping (or excess phase) produced in the output file. Also, I didn't realize that you could magnify the screen by cranking up the gain and zoom buttons. This makes it very easy to see the floor bounce in my measurement (7.2ms). So, I put the start curser at the very beginning of the impulse and then reduced the gate to 6.8ms to get rid of the floor bounce.
On the subject of saving the impulse file and bulk processing and converting to FRD's in VituixCAD, I tried to do this with SE impulse response files, but I get an error when attempting to open them in VituixCAD. It does not look like SE impulse files are supported in VituixCAD.
What you’ve done is actually a very good exercise to help understand phase relationships. Moving the FFT start and observing the phase change will demonstrate the “excess phase” added from the extra time of flight.
It looks like you have something reflecting around 10ms mark, it'll be responsible for all those little wiggles in the frequency response. It you want to keep the longer gate, maybe a bit of smoothing.
What’s the error message? You need to use the “export IR” button, not the “save IR”. Don’t know that I tested with v20, but you can always send me an impulse file and I’ll check it out on my end.
@dcibel said:
What you’ve done is actually a very good exercise to help understand phase relationships. Moving the FFT start and observing the phase change will demonstrate the “excess phase” added from the extra time of flight.
It looks like you have something reflecting around 10ms mark, it'll be responsible for all those little wiggles in the frequency response. It you want to keep the longer gate, maybe a bit of smoothing.
What’s the error message? You need to use the “export IR” button, not the “save IR”. Don’t know that I tested with v20, but you can always send me an impulse file and I’ll check it out on my end.
The reflections around the 10ms mark are my DIY polar table. The table is an old chair that I converted some time ago. The rotational platform is 17" above the floor and has extention 2x4"s bolted onto so that I can position a speaker or speaker stand to rotate the drivers on the Z axis. See pic. I probably need to place some pillows over the platform during measurements.
I used the "export IR" and not the "save IR" button. SE saves the IR file with a .txt extension. Here is the error I get when attempting to load it into VituixCAD:
Attached is the impulse file with .txt extension. It is very big for a .txt file, about 7.3 megs!
Comments
Whoo-Hoo! I discovered what I was doing wrong in Soundeasy. Everything seems to be working now. I hate to admit this, but I was simply hitting the wrong button on Soundeasy's MLS measurement screen. To generate the impedance curve from the impulse response, I was hitting the "IR > SPL" button when I should have been hitting the "IR > Zin" button! I simply could not find the "IR > Zin" button because the bottom 15% or so of the MLS measurement screen is cut off on my laptop and cannot be adjusted to show the bottom part only. My HP laptop has a maximum screen resolution of 1366x768 pixels and this particular screen in SE does not auto scale to fit this format. I tried changing my screen resolution to other settings, but the bottom of the MLS measurement screen was always cut off. Finally, in frustration, I hooked up an external LCD monitor via HDMI and this allowed me to change the screen resolution to 1440x900 pixels. That worked. I can now see and click all the buttons.
 ")
Here is Soundeasy's MLS measurement screen showing the impedance calibration with the speaker leads disconnected:
Here is Soundeasy's MSL measurement screen showing the impulse response and impedance curve with the ND90-8 connected:
And here is the TS parameter tab screen showing the added mass overlay and full T/S parameters. They are very close to what I measured previously with DATS V2 and LIMP.
I also opened up the ARTA program and performed the FR1 and FR2 jig loopback tests. They look very similar to dcibel's curves, except the left hand scale is different for some reason.
Thanks, dcibel. Very well written and easy to follow instructions.
All good, measurements are normal")
The loopback FR I showed was with my antique Realistic SA-1000. I explained there that modern equipment should be flatter on the low end as you show. In any case, the point of the exercise is to understand the natural frequency response of your equipment and to see that it is completely compensated for by this 2 channel measurement process.
Today I mounted the Sonarworks mic on the end of a powerPEX 1" diameter tube. I copied this idea from the picture that Wolf posted of Ben measuring the Missing Link speakers.
Visual parts list:
I folded thin strips of UltraTouch denim around the mic cable as I slid it into the tube:
The mic and XLR connector fit the inside diameter (.829" or 21mm) of this tube very well. I secured the mic in place with several turns of blue plastic electrical tape:
In taped a 9 inch long piece of 1/4" x 1" aluminum bar stock to the tube. The bar stock is drilled and tapped 1/4-20 to accept the quick-connect tripod mounting plates that I use.
The finished system, ready to take measurements.
It took me a while, but I was able to get Soundeasy working with the new SoundWorks mic, calibration file, and ARTA jig.
Here is a photo of my setup. I removed the 1/4" TRS cable that was plugged into the UR22's mic/line input 2 and replaced it with the microphone's XLR connector. Then I flipped the jig's SPL/IMP switch to "SPL". I flipped the UR22's rear panel switch to turn on the red "+48V" phantom light. And finally, I adjusted Mic/line input 2 to about the 3/4 level to match the gain for the REF and SPL channels.
I downloaded and installed the mic's calibration file using SE's Driver Parameter Editor to "repair" and add phase data to the file. The original cal file was 750 lines from 20Hz to 20kHz, so I modified SE's system-wide frequency range in preferences to match this bandwidth. I would have liked to set the bandwidth to 10Hz-50kHz, but the SE help file told me that I had to match these parameters (boo!)
Here is what the calibration file alone looks like. The uncalibrated mic is fairly flat at most frequencies and then rolls off by about 1-3dB or so at the highest frequencies.
For testing, I measured the small 8" two-way speaker that I brought to IowaDIY this past year. The measurement was taken at a distance of 28" on-axis to the tweeter, so I set SE's acoustical distance to 71cm. The distance from mic to floor was 60", so I set the gate to 7.03ms.
Here is what the measurement looks like without the calibration file loaded. Notice how the response peaks up at the higher frequencies.
Finally, here is the same speaker measured with OmniMic, using the same 28" on-axis mic position and 7.03ms gate. With OmniMic, I used the sine sweep, blended mode, and 1/96th smoothing.
Next up, I am going to measure the same speaker with ARTA.
You can use 10-50kHz, but you just have to fill in the gaps with the HBT response. Effectively you can record and operate to 50kHz, but the response is "uncalibrated" beyond 20kHz. I would operate SE to 50kHz with this in mind, as the extra information to show tweeter resonance, etc is nice to have.
I would recommend setting the HBT slope to 0db/oct though for the mic calibration file. This will create a flat line when you fill in to 10Hz and 50kHz, and for the 20Hz-20kHz response it will correct the phase at both ends. If you compare your calibrated/uncalibrated measurements above you can see how the HBT slope has messed with the phase at the frequency extents.
For a little extra information if you ever start using ARTA, the ARTA developer has told me that there is general disagreement on what constitutes minimum phase of a microphone, so ARTA simply doesn't compensate for phase at all, the calibration is amplitude only. He said that if you want to be real particular about phase in the top octave then better to get a mic that is flat to begin with before it's compensated with a calibration. For SE to calculate phase with accuracy you would need some knowledge of what the mic response looks like out of band, which we don't have, so you can assume some slope value or do like I do and assume perfection with 0dB/oct slope. With a 0dB slope your mic calibration phase will remain pretty much the same as the manufacturer provided in the original calibration file, provided the cal was provided with a phase column. If for some reason you had a mic that had a visible slope at the top end, I would simply set the slope of the HBT to match as usual.
If you compare your SoundID mic to your Omnimic and the measurements don't match exactly, decide which mic you trust the most and you can easily generate your own calibration file so that you get pretty much exactly the same response no matter which mic you use. To compare, just save each measurement and use the calculator tool in VituixCAD to overlay them. I would use ungated measurement for the comparison so you don't have differences from gating window type and that "blended" stuff that Omnimic does. Looking at the measurements above, they look pretty close, maybe a little different in the 10kHz range.
To create your own calibration, just take a ungated measurement of a half decent speaker, load the calibration for the mic you trust and measure with the other uncalibrated. Carefully change out the mics to be in the same location and distance from the speaker. With both measurements in hand you can use VituixCAD calculator tool and divide them to create a calibration file.
I had to calibrate my omnimic myself. I used a Cross Spectrum Labs mic as a reference, so that is an option Bill.
FWIW the screenshot in the SE manual (under the mic calibration section) suggests for mic calibation to use 0dB slope on the low end, and 8dB/oct slope on the top end, I guess that would be assuming that the high end response will drop off, but that slope is just an assumption, I would still call the response with either method as "uncalibrated" beyond 20kHz.
My OmniMic was originally calibrated by Parts Express and I am still using the calibration file that they gave me. The curves above for my new Soundworks mic and my old OmniMic look fairly close, but, as dcibel suggests, I will need to re-run these measurements without gating and then overlay them into VituixCAD's calculator tool. When Cross Spectrum Labs calibrates a mic, do you know if they measure it from 20Hz to 20kHz only? Or do they go out to 40kHz?
AFAIK CSL calibrates from 5Hz to 25kHz, but you really have to ask yourself how important it is to have +/-1dB accuracy of shit you can’t hear.
Good point. I'll just use the HBT response to fill in the gap. I just wanted to be able to measure out beyond 20kHz so that I could see the high frequency peaking on ceramic or beryllium dome tweeters.
and you can, just set the frequency range back to 50kHz range")
FWIW Parts Express calibrated mine as well but it was way off. Cross Spectrum goes 20-20k.
I recently had CSL calibrate an EMM-6 microphone, the .frd goes from 5 Hz up to 25 KHz.
Thanks for the correction Ed.
I had CSL calibrate my OmniMic and the cal file is from 4.33 Hz to 25,013 Hz.
Thanks for the calibration info. I ran two ungated frequency response comparison curves, using the same loudspeaker, and then overlayed the two curves in VituixCAD. The green curve was made with the calibrated Soundeasy/Soundworks SoundID mic combo. The blue curve was made with my calibrated OmniMic. Both curves were made with the mic tips carefully positioned 60" above the floor and 28" on axis with the tweeter. Ignoring the random noise differences below 100Hz, the curves are virtually identical up to about 2.5kHz. Then from 3-20kHz, they depart in two or three places by about 0.5 to 1dB. Some of this variation might be due to the fact that I simply could not position the microphone tip in "exactly" the same position for the two measurements (very close, but not exact).
So, I've decided to "trust" the new mic and calibration file for future builds. This mic is more than likely more accurate because it has the most recent calibration. My OmniMic is about 7 years old now and it may have drifted slightly out of tolerance over the years.
Bill put the mic right up against the tweeter, near field just like you would for a woofer. You should be able to get a better comparison between the two mics that way.
Good idea. I'll give that a try and report back.
Close enough. Just for some calculator tool fun, you have the option there to apply smoothing to get rid of some of that "noise". Also try selecting "divide A/B", then look around 0dB level, you should see a graph showing just the difference between the two measurements.
Ya, I tried the "divide A/B" function with additional smoothing and that works well to show the differences. I also tried moving the mic closer for the test, from 28" on axis to about 7" on-axis and that also helped to smooth out the noise at higher frequencies, even when using 1/48th smoothing. When I took measurements at a distance of 7" on-axis, the two mics are virtually idential all the way up to 8kHz. Then from about 9-17kHz, OmniMic measurements are about 1dB higher than the Sonarworks SoundID mic. Above 17kHz, the two mics are pretty much the same again.
Nick, I tried to put the mic right up against the tweeter, but that did not seem to be working. This is the Dayton RST28F-4 with the metal protective screen and plastic phase cap over the dome. When I got close with the mic, the response started bulging up at high frequencies, so I backed off to about 7 inches.
Today I was able to get the demo version of ARTA working with the jig and new mic. So, I'd like to post a few screen shots to show how I set things up. I did the best I could based on my reading of ARTA's help manual instructions. I measured the same speaker as before, with the mic tip 28" on axis with the tweeter and 60" above the floor.
Here is the ungated frequency response and phase screen, using a 2.125ms time of flight delay to eliminate excess phase:
Here is ARTA's cross correlation screen, showing how the 2.125ms delay was calculated:
Here is the frequency response measurement setup screen, showing the 2.125ms delay as well. This delay relates to the time it takes for the impulse to travel from the tweeter flange to the tip of the mic:
Here is the gated frequency response and phase, using a 7.03ms gate and 1/24th octave smoothing:
Here is the impulse response parameter screen, showing the 7.03ms gate and a few other parameters that I do not understand. I don't know what the gate 2 of 200ms means or where the 3.276 delay estimate value came from.
Finally, here is the impulse response screen, showing the gate of 7.03ms and the pre-delay of 3.276ms.
The "cross-correlation" in ARTA is basically just measuring the distance between the peak of the reference impulse to the measurement impulse. It is accurate to within 1 sample time, so it's close but not perfect. Depending on sample rate, using these delay values directly can create a fair bit of phase error.
At 48kHz, 1 sample error represents a +/- 38 degree phase shift at 5kHz
At 96kHz, 1 sample error represents a +/- 18 degree phase shift at 5kHz
At 192kHz, 1 sample error represents a +/- 9 degree phase shift at 5kHz
The good news is that determination of delay is not necessary at all for gathering accurate measurement data for loudspeaker design. All that really matters is that you lock the FFT window start position, and keep a constant distance between mic and speaker baffle for all measurements. By doing so, all delay will be inherently captured in the measured phase. Min phase? Forget about it. 3 measurement delay determination process? Forget about it.
The two gate times you see in the Impulse response parameters screen only apply to the "dual gate" frequency response. You can think of this as similar to the blended response in Omnimic, where Omnimic blends the gated measurement with an ungated response, here you have the same thing but with some control over the gate of the lower frequencies. It's not a feature I've ever really used for gathering information for loudspeaker design to be honest, it can be useful for some in-room measurements though.
For standard single gate frequency response, the gate time is determined by setting the cursors on the impulse response window, left click and right click. shift + cursor for fine adjustment 1 sample at a time. Gate width will be shown at the bottom.
Gate of 7.03ms, well you've right clicked at some point to set the window end location, at the bottom of the screen you can see it set at sample 675 and 7.031ms. You haven't left clicked to set the start time, so the start is t=0. Simply put, 675 samples at 96kHz is 7.03ms.
The problem with t=0 in ARTA is that it isn't where the reference signal starts. The reference signal will always be at sample 300, use the "home" key on your keyboard to set the cursor there. If you want to get quick and dirty time of flight determination, measure from sample 300 to your measured impulse, not by looking directly at the time scale on the impulse chart.
Pre-delay is used to add excess delay prior to the FFT start location, you can leave it set to zero for the most part.
Would this be the correct way to do it?
Cursor at sample 300 with 7.03ms gate:
Resulting gated FR and phase screen:
Ungated FR and phase screen prior to converting to impulse response:
Impulse response parameters screen:
Not exactly. I mean you _can _do it like that, but I wouldn't. You don't need to place the start of the FFT at sample 300, just place anywhere close to but before the impulse. I always hit the gain and zoom buttons on the right hand side too. Crank up the gain so the reflections in the impulse are clear, otherwise the gate length is a bit of guesswork.
With the start of the FFT at 300 you are including the entire time of flight to the driver, which is a lot of excess phase making the phase plot real hard to look at with so many cycles.
The kicker with the start of the FFT gate, is that ARTA doesn't include any "front gate" so it won't capture the frequency response properly if you place the start of the gate in front of the impulse. What this means is that when you set your start gate for measuring all drivers in a speaker, you should use the driver closest to you to set the FFT start location to ensure all measurements fall in the gate. In most cases that would be the tweeter, but not always if you are doing a horn design for example.
What I meant for using sample 300 for simple time of flight measurement, is that you can see above that sample 300 is at time 3.125ms. If you then hit the "max" button to set the cursor at the peak of the impulse, it will tell you a time location, subtract 3.125ms for the time of flight from driver to mic +/- 1 sample time. You can use left and right click and use the gate length at the bottom to do the same thing. It should be roughly the same time as what that "cross correlation" window told you.
If you purchase a ARTA license so the impulse response files can be saved, all this processing can be done in bulk for all your measurements in VituixCAD, and with better FFT processing features such as that front window I mentioned. All that really needs to be done in ARTA is just record, save file, repeat.
Measuring time of flight
Setting gate for reflection free FR
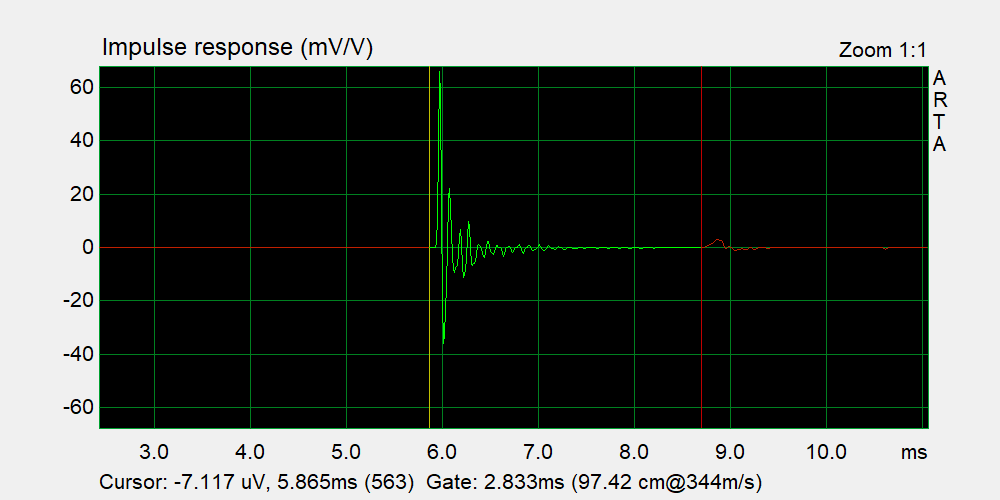
Thanks again for all the great tips. I think I am finally beginning to understand how this process actually works. The closer you put the start curser to the beginning of the impulse, the less phase wrapping (or excess phase) produced in the output file. Also, I didn't realize that you could magnify the screen by cranking up the gain and zoom buttons. This makes it very easy to see the floor bounce in my measurement (7.2ms). So, I put the start curser at the very beginning of the impulse and then reduced the gate to 6.8ms to get rid of the floor bounce.
On the subject of saving the impulse file and bulk processing and converting to FRD's in VituixCAD, I tried to do this with SE impulse response files, but I get an error when attempting to open them in VituixCAD. It does not look like SE impulse files are supported in VituixCAD.
What you’ve done is actually a very good exercise to help understand phase relationships. Moving the FFT start and observing the phase change will demonstrate the “excess phase” added from the extra time of flight.
It looks like you have something reflecting around 10ms mark, it'll be responsible for all those little wiggles in the frequency response. It you want to keep the longer gate, maybe a bit of smoothing.
You should be okay with SE, I helped out with the instructions for VituixCAD here:
https://kimmosaunisto.net/Software/VituixCAD/VituixCAD_Measurement_SoundEasy.pdf
What’s the error message? You need to use the “export IR” button, not the “save IR”. Don’t know that I tested with v20, but you can always send me an impulse file and I’ll check it out on my end.
IIRC you need to keep the impulse window the same for all the measurements.
The reflections around the 10ms mark are my DIY polar table. The table is an old chair that I converted some time ago. The rotational platform is 17" above the floor and has extention 2x4"s bolted onto so that I can position a speaker or speaker stand to rotate the drivers on the Z axis. See pic. I probably need to place some pillows over the platform during measurements.
I used the "export IR" and not the "save IR" button. SE saves the IR file with a .txt extension. Here is the error I get when attempting to load it into VituixCAD:
Attached is the impulse file with .txt extension. It is very big for a .txt file, about 7.3 megs!