I don't see anything wrong in that thread. CTA 2034A standard is 10 degree increments, 2m distance, on axis as specified by mfg.
CTA 2034A is a standard for measuring a complete home speaker. All of the individual driver measurements that we make (likely at 1m) are for xo design that will result in good Spinorama performance. But CTA 2034A is not a standard for xo measurements.
CTA-2034 is a standard for measuring and amplitude performance of a loudspeaker in a common format, which can be applied to complete speaker systems or individual drivers. The intent is to present data that represents a "normal" listening distance in a "normal" room, and in a common format that can be directly compared and reproduced. Full measurement data from 1m driver measurement (or a distance sufficiently "far field"), can be presented in VituixCAD at any distance. Pressing "CTA-2034" button in preferences will set options to present data following CTA-2034 format. 1m measurement of complete speaker is not CTA-2034 spin, may be very close / good enough for bookshelf speakers however, with increasing error the larger the speaker due to difference is driver distance and angle relative to the mic. With the many notes presented in the ASR instruction, this was not one of them.
Instruction at ASR is very long with many steps that could easily be simplified down to follow basically some slightly modified version of the VituixCAD measurement guide. There are many steps being completed within REW, Diffraction coming from Jeff's spreadsheet, then the result is brought in to VituixCAD merger tool. Most can be simplified down to use VituixCAD diffraction tool and merge tool for all the level adjustment and inclusion of diffraction. You have to use the merge tool anyway so most of step 4 for adjusting levels and importing diffraction to REW can be skipped, just measure response and export from REW, adjust levels and load diffraction in VituixCAD merge tool. Why are we getting out a spreadsheet if we're already using VituixCAD? There is also instruction to use Tukey 0.1 windowing, which is basically a brick wall window, not very good decision for merging far field with near field.
But enough about ASR instructions...Focus here should be on what is needed to validate a design completed with VituixCAD. In designing with VituixCAD, you will already have a complete spinorama, so what would be the purpose of reproducing this chart of the final speaker, other than to verify that original data was error free and crossover assembly is correct? The point I have been trying to make in previous posts is that full spinorama is not necessary for validation to make sure you have it right, and especially, measurement of complete speaker at 1m should not be compared to a crossover simulation at a distance other than 1m. Perhaps with my next speaker I build I could gather some data to create a "Design Validation Guide for VituixCAD", if there's any interest for that.
I see what you mean. I get a much better agreement between my final 1 meter validation measurement and my VituixCAD model by switching the model's listening distance to 1000mm. There should, therefore, be no need to do an actual 2 meter measurement outside or go to the additional effort of taking individual driver measurements with the final crossover installed. If my model, with listening distance adjusted to 1000mm, agrees with my final 1000mm single axis measurement, then I am good to go and can conclude that I did not make any major mistakes when setting up my model. Since I am relatively inexperienced and have only done a few models in VituixCAD so far, my major concern is with catching and then correcting my own measurement or computer setup errors. Thanks again, dcibel, for all your help with my project!
A 50 dB scale looks nice for manufacturers or marketting, but when designing a crossover even a 1dB can make or break for design. Consider zooming in to view your CTA2034A over 10dB. It’s disconcerting at first, probably because there are about 5 lines for you to manage, and it’s wobbling all over the place. But after you tune roughly, then tune finely. In the days of lspCAD when I did passive crossovers it can takes months fine tuning, and even end in a complete failure. Now with VituixCAD2, it can take just weeks.
I think we are on the same page here. I have VituixCAD options set up for an aspect ratio of 25dB/dec. In the 6 pack mode, the graphs are pretty small, so as I tweak, I will often double click on a graph to blow it up to the entire 6 pack screen area. This gives me plenty of resolution to see small 1dB changes. But I also like to stay in the smaller 6 pack mode most of the time, because this gives me instant feedback on on-axis, listening window, in-room, power, directivity, group delay, impedance, etc., as I tweak the xover. This is one of the best features of VituixCAD: The ability to see "everything" as you tweak.
Since a dB is so significant, I’ve switched to a larger screen than my 13” laptop. Also, pixel staring ain’t no fun when you’re past mid-life.
I find taking accurate measurements a bigger problem than the accuracy of the crossover simulator- and VituixCAD has a far better UI than SoundEasy; which still looks like it has come from the days of Windows 3.1. Yech. I almost bought the automatic turntable that George Soong has on offer, but I refuse to use SE.
The inaccuracies that I’ve run into an elsewhere.
Recently I noticed one of my passive radiator models wasn’t in agreement with the actual results. I’ve previously used the PR models and has good results. But this time I had a tiny 4” midwoofer paired to twin 5.25” SB13PFCR passives; which has a moving mass of 35g. According to the model; I needed to add 40g added mass to each. Instead of giving a flat response to 50Hz in 2.5L, it resulted in an over-damped response- response from the PR was very broad and very low.
The bass from the PR was all but gone!
I had to remove 30g from each PR to the response that I wanted.
I’m not sure if it was related to how much stuffing I had, or how lossy my enclosure was. Or perhaps adding too much mass to a PR affects it adversely.
In the end I had ignore the model and just construct, measure and reiterate until it was right.
Merger. For a multi-way at what frequency should one merge the near field with the far field? Should I go has high as possible eg. 600 Hz; as the LF starts to lose precision? Of should I be looking at how well the blue and red overlap in the off axis angle? And so if the merging results create differing results, it will affect baffle step compensation requirements. And then I thought; well any given room is going to affect the response below the Schroeder frequency than the Merged result, so why worry?
More investigation required.
It just makes you about think about Audio Nirvana- perhaps it’s an illusion as long as every room and every recording studio is different we are still in the circle of confusion.
Maybe that’s why traditional hi-fi is dying as a market in general. Has it gone as far as it can go?
Apparently automotive audio and headphones are a much bigger industry than home audio. Home audio only accounts for about 15% IIRC.
I guess one thing designer of automotive sound systems can do is can predict and control for the acoustics of the vehicle they are designing for. And in headphones it takes the room out of the equation; although headphones have their own problems, millions of people using them don’t complain about that the “in the head” feeling”; that’s only apparent to audiophiles.
@tktran said:
2. Merger. For a multi-way at what frequency should one merge the near field with the far field? Should I go has high as possible eg. 600 Hz; as the LF starts to lose precision? Of should I be looking at how well the blue and red overlap in the off axis angle? And so if the merging results create differing results, it will affect baffle step compensation requirements.
Merge should occur in an area with clear overlap between near and far field response. Big drivers on big baffles measured in-room, resolution becomes low so merge point can be less clear.
A few tips:
Use VituixCAD Auxiliary -> Near field tab to determine effective useful frequency range for nearfield response. Time window tab will show effective frequency range for far field response. Without some overlap between near and far you are going to have some trouble.
Window type is important as well as window length. I recommend Tukey 0.75 or Cosine window type to reduce overshoot/undershoot of window through low frequencies where resolution is lacking.
Spot check of off-axis angles should always be completed. Far off-axis where measured SNR can be low can result in inconsistent slope of response on the low end. One solution would be to increase SNR by measuring louder and with multiple measurement averaging, and ensure quiet space. Alternatively measurements as-is can be fixed through use of "force to gradient". I provided example of the problem and force to gradient fix here: https://www.diyaudio.com/community/threads/vituixcad.307910/post-7250405
For some merge examples, I captured some details provided by Kimmo in previous discussions from VituixCAD thread on HTG and DIYA here, have a look at the "near field / far field merging examples", as well "windowing types" are very useful information IMO. https://drive.google.com/file/d/12xUt4vHfakLBP1x-_eZDuC2-PrYwyehP/view?usp=share_link
And then I thought; well any given room is going to affect the response below the Schroeder frequency than the Merged result, so why worry?
One option is to provide basic crossover to optimize driver response for distortion and directivity, and provide all fine tuning with external EQ / DSP, decision on how to get the best out of what you have is ultimately yours.
@ani_101 said:
I am interested too. Have those ribbons, yet to put them to use. How low you suppose they can go?
>
Ani, the mfg says you can cross the CQ76B as low as 1kHz. I am crossing about 1.8kHz or so, depending on how you interpret my schematic (see above). I'll put put together a zipped file of measurements and post them here. Bill
Here you go. I measured the CQ76B from 0 to 90 degrees in 7.5 degree increments. Four different baffle shapes were measured, 1 meter on axis. As I recall, I used a cosine window and 4.6ms gate when creating the FRD's from the impulse files in VituixCAD. I am only sending the FRD's because the impulse files are simply too big (95megs verses approx 350k for the zip file).
The baffles:
1) Flush mounted on my rotating IEC test baffle (52.5 x 64 inches)
2) Flush mounted on 14 x 39" baffle with 2.5" radius roundovers on the top and both sides.
3) Flush mounted on 9 x 39" baffle with 0.75" radius roundovers on the top and both sides.
4) Flush mounted on 9 x 39" baffle with 2.25" to 0.75" tapered roundovers from the top to the sides.
In addition to the baffle dimensions, you will need to know where the tweeter was mounted on the baffle. For the IEC test baffle, the tweeter was mounted according to the standard offset specs. For the 39" high baffles, the center of the tweeter diaphram was located 4.5" down from the top of the baffle and then centered from side to side. Enjoy! Bill
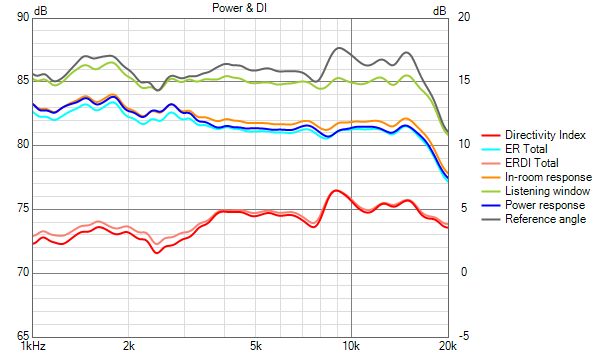
I selected the 9" wide baffle with tapered 2.25" to 0.75" roundovers from the top to the sides. This shape produced the flatest on and off axis set of curves, compared to the IEC baffle. I played the speakers at InDIYana, but they sounded bright (to me). They suffer from the "bulging knee" problem in the power and in-room response curves. The bulging knee is from approximately 2 to 5kHz. I'm still trying to figure out how to fix them.
@4thtry said:
I selected the 9" wide baffle with tapered 2.25" to 0.75" roundovers from the top to the sides. This shape produced the flatest on and off axis set of curves, compared to the IEC baffle. I played the speakers at InDIYana, but they sounded bright (to me). They suffer from the "bulging knee" problem in the power and in-room response curves. The bulging knee is from approximately 2 to 5kHz. I'm still trying to figure out how to fix them.
Interesting problem. IIRC, Jeff Bagby said that you can't fix an off axis problem in the crossover. IDK though.
But Chahly - Stahkist don't want speakers that look good, Stahkist wants speakers that sound good!
@4thtry said:
I selected the 9" wide baffle with tapered 2.25" to 0.75" roundovers from the top to the sides. This shape produced the flatest on and off axis set of curves, compared to the IEC baffle. I played the speakers at InDIYana, but they sounded bright (to me). They suffer from the "bulging knee" problem in the power and in-room response curves. The bulging knee is from approximately 2 to 5kHz. I'm still trying to figure out how to fix them.
Interesting problem. IIRC, Jeff Bagby said that you can't fix an off axis problem in the crossover. IDK though.
Kind of true - if you use traditional 4th LR topology, the off-axis bloom is going to be there it is inherent to the topology. However, on most baffles there is a dip followed by a boost as frequency decreases. This dip can be made to be coincident with the off-axis bloom, reducing radiated energy in the range.
We can definitely compensate for off-axis behavior with our crossover choices. The problem occurs when we focus so narrowly on the on-axis measurement and getting that "flat" that we create speakers that sound bright when the single axis measurement indicates they shouldn't.
There ya go, a "secret".
Thanks, JR. One of these days I'm going to figure this all out. But I'm still searching for the secret sauce.
Comments
I don't see anything wrong in that thread. CTA 2034A standard is 10 degree increments, 2m distance, on axis as specified by mfg.
CTA 2034A is a standard for measuring a complete home speaker. All of the individual driver measurements that we make (likely at 1m) are for xo design that will result in good Spinorama performance. But CTA 2034A is not a standard for xo measurements.
CTA-2034 is a standard for measuring and amplitude performance of a loudspeaker in a common format, which can be applied to complete speaker systems or individual drivers. The intent is to present data that represents a "normal" listening distance in a "normal" room, and in a common format that can be directly compared and reproduced. Full measurement data from 1m driver measurement (or a distance sufficiently "far field"), can be presented in VituixCAD at any distance. Pressing "CTA-2034" button in preferences will set options to present data following CTA-2034 format. 1m measurement of complete speaker is not CTA-2034 spin, may be very close / good enough for bookshelf speakers however, with increasing error the larger the speaker due to difference is driver distance and angle relative to the mic. With the many notes presented in the ASR instruction, this was not one of them.
Instruction at ASR is very long with many steps that could easily be simplified down to follow basically some slightly modified version of the VituixCAD measurement guide. There are many steps being completed within REW, Diffraction coming from Jeff's spreadsheet, then the result is brought in to VituixCAD merger tool. Most can be simplified down to use VituixCAD diffraction tool and merge tool for all the level adjustment and inclusion of diffraction. You have to use the merge tool anyway so most of step 4 for adjusting levels and importing diffraction to REW can be skipped, just measure response and export from REW, adjust levels and load diffraction in VituixCAD merge tool. Why are we getting out a spreadsheet if we're already using VituixCAD? There is also instruction to use Tukey 0.1 windowing, which is basically a brick wall window, not very good decision for merging far field with near field.
But enough about ASR instructions...Focus here should be on what is needed to validate a design completed with VituixCAD. In designing with VituixCAD, you will already have a complete spinorama, so what would be the purpose of reproducing this chart of the final speaker, other than to verify that original data was error free and crossover assembly is correct? The point I have been trying to make in previous posts is that full spinorama is not necessary for validation to make sure you have it right, and especially, measurement of complete speaker at 1m should not be compared to a crossover simulation at a distance other than 1m. Perhaps with my next speaker I build I could gather some data to create a "Design Validation Guide for VituixCAD", if there's any interest for that.
I see what you mean. I get a much better agreement between my final 1 meter validation measurement and my VituixCAD model by switching the model's listening distance to 1000mm. There should, therefore, be no need to do an actual 2 meter measurement outside or go to the additional effort of taking individual driver measurements with the final crossover installed. If my model, with listening distance adjusted to 1000mm, agrees with my final 1000mm single axis measurement, then I am good to go and can conclude that I did not make any major mistakes when setting up my model. Since I am relatively inexperienced and have only done a few models in VituixCAD so far, my major concern is with catching and then correcting my own measurement or computer setup errors. Thanks again, dcibel, for all your help with my project!
I think we are on the same page here. I have VituixCAD options set up for an aspect ratio of 25dB/dec. In the 6 pack mode, the graphs are pretty small, so as I tweak, I will often double click on a graph to blow it up to the entire 6 pack screen area. This gives me plenty of resolution to see small 1dB changes. But I also like to stay in the smaller 6 pack mode most of the time, because this gives me instant feedback on on-axis, listening window, in-room, power, directivity, group delay, impedance, etc., as I tweak the xover. This is one of the best features of VituixCAD: The ability to see "everything" as you tweak.
Since a dB is so significant, I’ve switched to a larger screen than my 13” laptop. Also, pixel staring ain’t no fun when you’re past mid-life.
I find taking accurate measurements a bigger problem than the accuracy of the crossover simulator- and VituixCAD has a far better UI than SoundEasy; which still looks like it has come from the days of Windows 3.1. Yech. I almost bought the automatic turntable that George Soong has on offer, but I refuse to use SE.
The inaccuracies that I’ve run into an elsewhere.
The bass from the PR was all but gone!
I had to remove 30g from each PR to the response that I wanted.
I’m not sure if it was related to how much stuffing I had, or how lossy my enclosure was. Or perhaps adding too much mass to a PR affects it adversely.
In the end I had ignore the model and just construct, measure and reiterate until it was right.
More investigation required.
It just makes you about think about Audio Nirvana- perhaps it’s an illusion as long as every room and every recording studio is different we are still in the circle of confusion.
Maybe that’s why traditional hi-fi is dying as a market in general. Has it gone as far as it can go?
Apparently automotive audio and headphones are a much bigger industry than home audio. Home audio only accounts for about 15% IIRC.
I guess one thing designer of automotive sound systems can do is can predict and control for the acoustics of the vehicle they are designing for. And in headphones it takes the room out of the equation; although headphones have their own problems, millions of people using them don’t complain about that the “in the head” feeling”; that’s only apparent to audiophiles.
Merge should occur in an area with clear overlap between near and far field response. Big drivers on big baffles measured in-room, resolution becomes low so merge point can be less clear.
A few tips:
https://www.diyaudio.com/community/threads/vituixcad.307910/post-7250405
For some merge examples, I captured some details provided by Kimmo in previous discussions from VituixCAD thread on HTG and DIYA here, have a look at the "near field / far field merging examples", as well "windowing types" are very useful information IMO.
https://drive.google.com/file/d/12xUt4vHfakLBP1x-_eZDuC2-PrYwyehP/view?usp=share_link
One option is to provide basic crossover to optimize driver response for distortion and directivity, and provide all fine tuning with external EQ / DSP, decision on how to get the best out of what you have is ultimately yours.
>
Ani, the mfg says you can cross the CQ76B as low as 1kHz. I am crossing about 1.8kHz or so, depending on how you interpret my schematic (see above). I'll put put together a zipped file of measurements and post them here. Bill
Here you go. I measured the CQ76B from 0 to 90 degrees in 7.5 degree increments. Four different baffle shapes were measured, 1 meter on axis. As I recall, I used a cosine window and 4.6ms gate when creating the FRD's from the impulse files in VituixCAD. I am only sending the FRD's because the impulse files are simply too big (95megs verses approx 350k for the zip file).
The baffles:
1) Flush mounted on my rotating IEC test baffle (52.5 x 64 inches)
2) Flush mounted on 14 x 39" baffle with 2.5" radius roundovers on the top and both sides.
3) Flush mounted on 9 x 39" baffle with 0.75" radius roundovers on the top and both sides.
4) Flush mounted on 9 x 39" baffle with 2.25" to 0.75" tapered roundovers from the top to the sides.
In addition to the baffle dimensions, you will need to know where the tweeter was mounted on the baffle. For the IEC test baffle, the tweeter was mounted according to the standard offset specs. For the 39" high baffles, the center of the tweeter diaphram was located 4.5" down from the top of the baffle and then centered from side to side. Enjoy! Bill
Here is the graphical representation of these measurements. with thanks to Bill.
A brief recap- here is the legend with an un-named random driver:
1) CQ76B on IEC baffle:
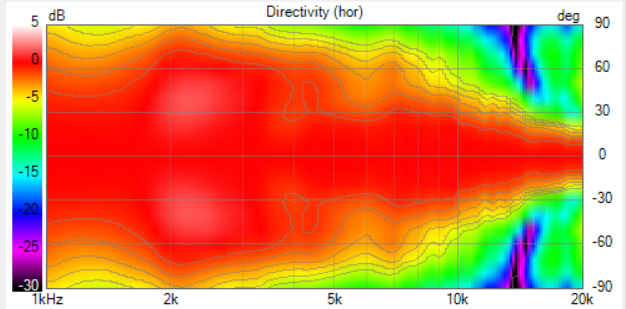
2) 14" wide baffle with 2.5" roudover:
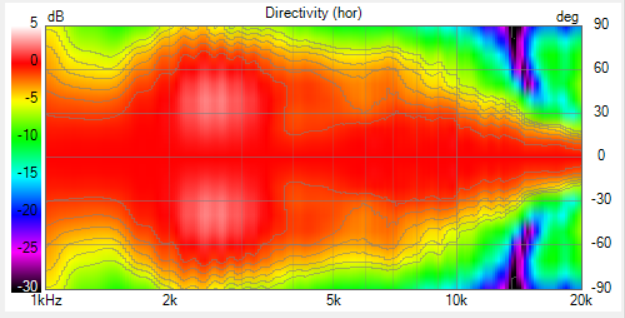
3) 9" wide baffles with 3/4" roundover:
4) 9" wide baffle with tapered 2.25" to 0.75" tapered roundovers from the top to the sides:
Normalized Polar maps compared:
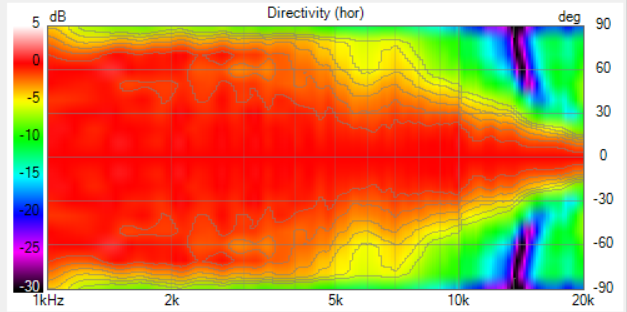
1)
2)
3)
4)
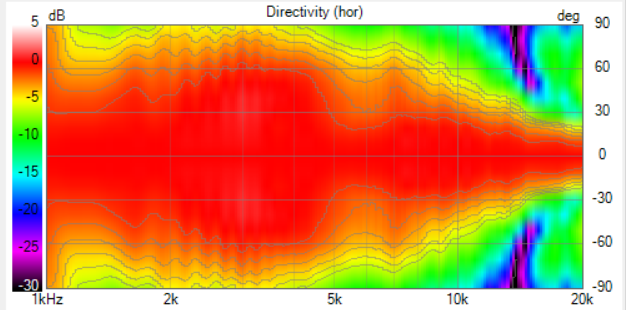
Now for the $64 question: which baffle did you decide on in the end, Bill, and for what reasons?
I selected the 9" wide baffle with tapered 2.25" to 0.75" roundovers from the top to the sides. This shape produced the flatest on and off axis set of curves, compared to the IEC baffle. I played the speakers at InDIYana, but they sounded bright (to me). They suffer from the "bulging knee" problem in the power and in-room response curves. The bulging knee is from approximately 2 to 5kHz. I'm still trying to figure out how to fix them.
Interesting problem. IIRC, Jeff Bagby said that you can't fix an off axis problem in the crossover. IDK though.
Kind of true - if you use traditional 4th LR topology, the off-axis bloom is going to be there it is inherent to the topology. However, on most baffles there is a dip followed by a boost as frequency decreases. This dip can be made to be coincident with the off-axis bloom, reducing radiated energy in the range.
We can definitely compensate for off-axis behavior with our crossover choices. The problem occurs when we focus so narrowly on the on-axis measurement and getting that "flat" that we create speakers that sound bright when the single axis measurement indicates they shouldn't.
There ya go, a "secret".
@4thtry
Please consider acoustic LR2 at a higher frequency eg. 2.5KHz or above.
About to hop on a plane; will write more to explain why it may be helpful later.
BR,
Thanh
Sounds like a plan. Will check into this.
Thanks, JR. One of these days I'm going to figure this all out. But I'm still searching for the secret sauce.")
Please see this post:
https://diy.midwestaudio.club/discussion/comment/48345/#Comment_48345