Please review the site Rules, Terms of Service, and Privacy Policy at your convenience. Rules, TOS, Privacy
Get familiar with the reaction system: Introducing the Reaction System

XSIM

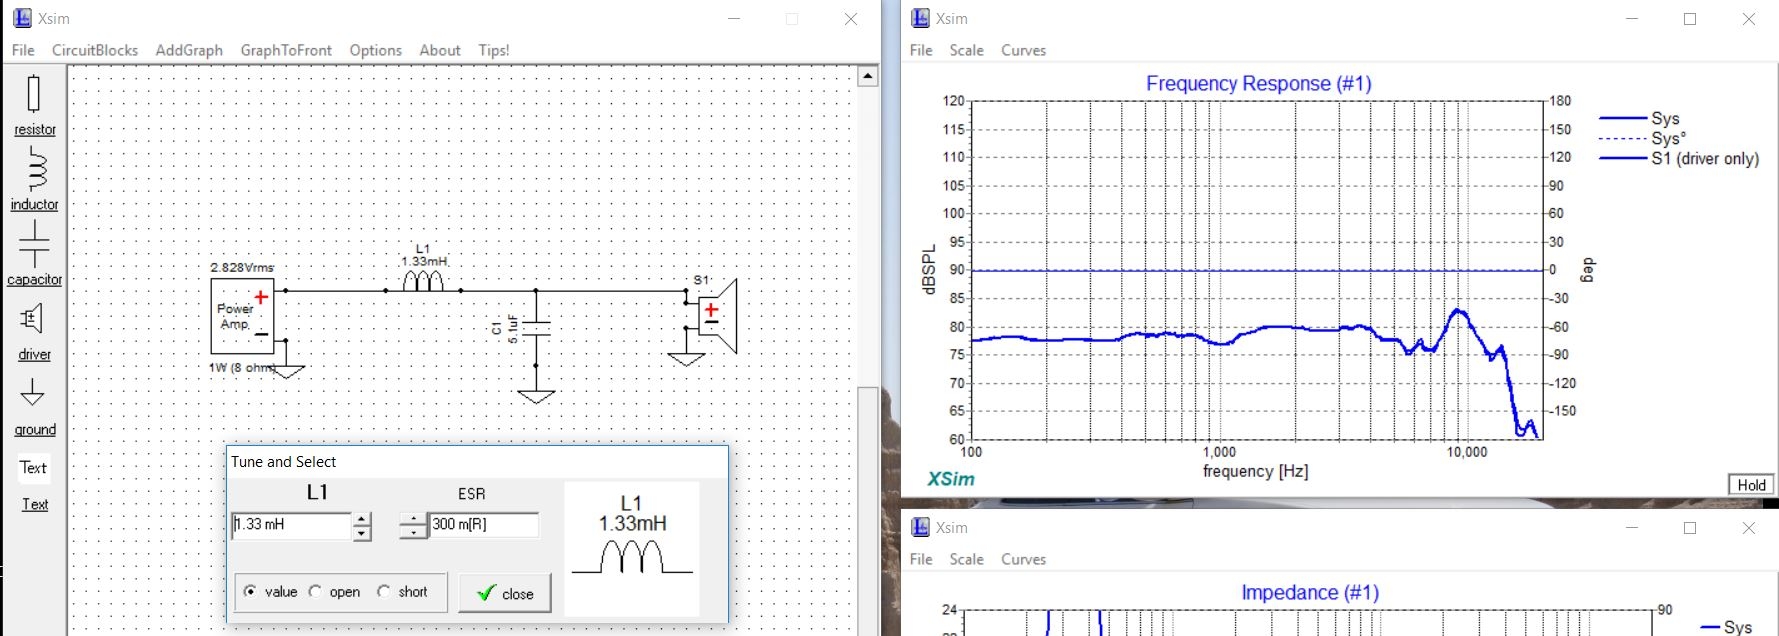
What am I missing here guys? I imported FRD and ZMA files from graph tracer . They seem to load correctly. Im just wanting to try different values on a single woofer . When I change or "tune" the values I would expect to see the frequency response move with it , the impedence graph changes some but not the FR of the driver? I checked out the youtube vid Ryan posted but I must be missing something. I dont think I need a tweeter in the mix but maybe I do ?  
TIA
Nick

«1

Comments

  • You've got a line driven through that inductor shorting it out.
    jr@macNicholas_23Turn2
    I'm not deaf, I'm just not listening.
  • Well , hell . Thank you for the quick response , that did it. Much appreciated dB
    dcibel
  • Sorry to bother again guys , but where can you view the phase of the drivers as you go about the design process?
  • Go to the FR window, pull up the "Curves" menu, and open the woofer curve.
    There is a checkbox there for "show phase".  There is a similar checkbox for the "System" curve.
    Nicholas_23
    But Chahly - Stahkist don't want speakers that look good, Stahkist wants speakers that sound good!
  • Thanks for all the info gents , Ill poke around some more with this when i get home tonight . 
  • Thanks again guys , would anyone want to interpret the phase on this two way? Call me out on anything that looks off. 
  • S2 looks like the tweeter and the phase doesn't look right. I would expect it to wrap at the knee.  Did you extract min phase?
     John H, btw forum has decided I don't get emails
  • I'd say they were about 105-110* off at the crossover point, what's it look like with reversed phase?
    deadhorse - leviathan - harbinger - shockwave (wip)
  • I guess you could get this phase shape with a large offset added to the tweeter
     John H, btw forum has decided I don't get emails
  • How was phase obtained? It appears far too smooth considering the driver response, almost like the driver files contain no phase information and you are only looking at the phase of the electrical filter. Also, where the phase "wraps" is unimportant, what is important is that your driver phase doesn't line up at the crossover point, you have ~75 degrees between drivers. How I would look at this is that the speaker forward axis is not the listening axis (straight ahead), if you go off-axis where the phase does line up (the speaker forward axis), you will now have a peak at the crossover frequency. Unfortunately, limits of Xsim prevent this sort of visual analysis. 
    I'm not deaf, I'm just not listening.
  • Thanks for the reply guys , I thought the phase on the tweeter looked off as well which is what promted the post. Since my upgraded version of SE does not want to play nice on my PC ,Ive decided to Let Bohden keep the money and move on , hence XSIM ans REW. Anyways .... sorry kind of went off the road there. All FRD and ZMA measurements were pull from the manufacturer specs and traced in . None of these measurements are measured in/on a baffle. Im just, at this point , trying to get my feet wet with XSIM and see what it can do . I really like it so far! 
  • Ok, so if you've traced the frequency response, the standard process for this would be to take the manufacturer infinite baffle response, apply your baffle diffraction, apply HBT (tails), then extract minimum phase to get data accurate enough for crossover simulation use.

    If it's just a traced frequency response, then you have missed a few steps, the results obtained in Xsim won't be anywhere close to reality since the data input doesn't include the baffle step or any phase data. That being said, Xsim is a super simple program, especially compared to SE, so it looks like you've got a handle on it.

    As far as going through the steps above, for free solutions there's a few options out there, if you like spreadsheets Jeff B has put together a FRD response blender spreadsheet which has a simple diffraction simulator built in, so you can load your traced FRD, apply baffle step, tail the response and extract minimum phase all in one sheet.
    Nicholas_23
    I'm not deaf, I'm just not listening.
  • No, Charlie Laub made  the Blender. Jeff's program is called Response Modeler.
  • My spreadsheet says they both made it, but that's beside the point.
    I'm not deaf, I'm just not listening.
  • The Blender is more difficult to add the baffle to FRDs as you can only add the baffle diffraction into the data loaded in the LF data tab. 

    It's easier to add the baffle in Response Modeler to the factory FRD.   Adjust the tails in the Blender by only loading the FRD saved from RM into the HF tab.

    Unfortunately it's still a two spreadsheet process.
    Nicholas_23
     John H, btw forum has decided I don't get emails
  • edited January 2018
    John, you can use the FRD blender, and skip the HF tab entirely since we are not actually using the sheet for blending.

    One spreadsheet process using FRD Blender, step-by-step
    1. Goto low frequency tab and load traced FRD
    2. Goto diffraction tab and mess with the diffraction thingy, then press "use diffraction model"
    3. Goto control tab, you should see your response here now with the diffraction included. Go ahead and adjust the tails as needed to make a clean low and high end response.
    4. Extract minimum phase.
    5. Save the file

    Easy peasy.


    Nicholas_23
    I'm not deaf, I'm just not listening.
  • The main problem I have with the Blender, is that you can't have other Excel sheets open when you extract phase with it. Since I have everything open when I'm doing a sim, it's a pain to have to close all but the Blender, do that one step, and then open them all back up again. This is why I never moved from using RM for a majority of my baffle/diff/phase routines.
  • Did you get a high frequency tail to adjust? dcibel said:
    John, you can use the FRD blender, and skip the HF tab entirely since we are not actually using the sheet for blending.

    One spreadsheet process using FRD Blender, step-by-step
    1. Goto low frequency tab and load traced FRD
    2. Goto diffraction tab and mess with the diffraction thingy, then press "use diffraction model"
    3. Goto control tab, you should see your response here now with the diffraction included. Go ahead and adjust the tails as needed to make a clean low and high end response.


     John H, btw forum has decided I don't get emails
  • Tails are applied to the "combined response", in my screenshot you can see the high frequency tail starts at 9kHz.
    I'm not deaf, I'm just not listening.
  • The high frequency tail does not function for me unless I load data into the HF tab
     John H, btw forum has decided I don't get emails
  • You just have to make sure the start freq for the tail is less than the last data point in your data.I verified it works in Office 2003 and 2016. If you can't make it work that way, take 3 columns, copy and paste from LF sheet to HF sheet and off you go again.
    I'm not deaf, I'm just not listening.
  • Ha, thanks!  My data was only going out to 19,900 Hz in most every FRD I tested!

    Time to put RM back on the shelf...

    dcibel
     John H, btw forum has decided I don't get emails
  • For most woofers and some mids, the tail should be before the end of the measurement so you remove the noise floor from where the driver rolls off naturally. For drivers that have response to 20kHz you are just providing the data trend beyond the measurement.
    I'm not deaf, I'm just not listening.
  • I trim the LF tail on most tweeters and mids to clean up the response but for tweeters I'm mostly concerned about the phase implications.  I'm looking to get closer to a true minimum phase response.
     John H, btw forum has decided I don't get emails
  • Great info guys , thank you . Im sure it will make more sense once I have blender downloaded and start messing with it. This is getting bookmarked 
  • Not trying to hijack your thread, but I have a question that I believe applies to the thread in general. 

    Is there a way to adjust x,y, and (particularly) z axis in xsim, since that will affect delay and ultimately phase alignment?
  • dynamo said:
    Not trying to hijack your thread, but I have a question that I believe applies to the thread in general. 

    Is there a way to adjust x,y, and (particularly) z axis in xsim, since that will affect delay and ultimately phase alignment? 

    You can't adjust X,Y in the current version, but you can adjust Z offset. Go to "tune" the driver popup and there is a field there.  Billl is currenty working on geometry and off axis response, per his thread a diyaudio.
    But Chahly - Stahkist don't want speakers that look good, Stahkist wants speakers that sound good!
  • edited January 2018

    To convert from PCD to XSim, I get good correlation using the right triangle theorem to calculate the (hypotenuse (measurement distance to the woofer) + Z offset) minus the tweeter measurement distance equals the XSim delay. 

    Just watch for the change in signs and the conversion to inches from meters.

     John H, btw forum has decided I don't get emails
  • rjj45 said:
    dynamo said:
    Not trying to hijack your thread, but I have a question that I believe applies to the thread in general. 

    Is there a way to adjust x,y, and (particularly) z axis in xsim, since that will affect delay and ultimately phase alignment? 

    You can't adjust X,Y in the current version, but you can adjust Z offset. Go to "tune" the driver popup and there is a field there.  Billl is currenty working on geometry and off axis response, per his thread a diyaudio.
    XSim 3D with polars.  Wow!!  Thanks for the reference.
Sign In or Register to comment.