Site Links
Howdy, Stranger!
It looks like you're new here. If you want to get involved, click one of these buttons!
Quick Links
Categories
In this Discussion
Who's Online (0)
10"2way
in DIY
Posted a couple teaser pics on pett and fb. Thought id give you gents a bit more info on this.
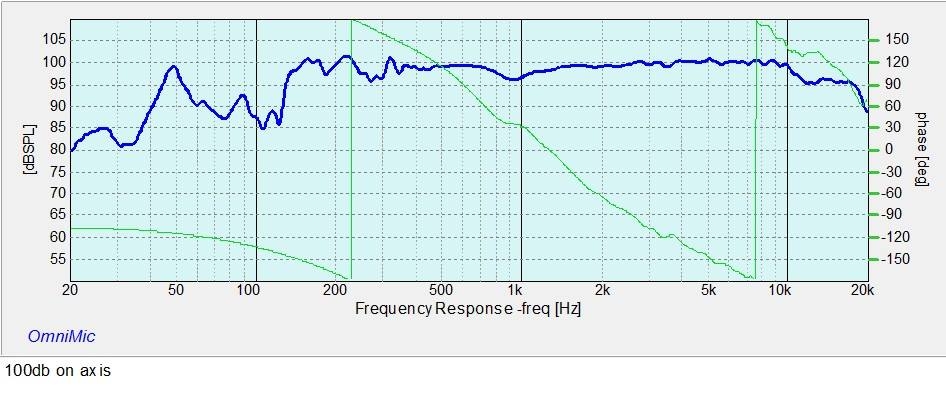
My friend Mike who was vice president of SP Technology and the one who designed their waveguide milling machine, has built a new and improved version. The guide here is 10" in diameter and about 2" deep. This gave me a nice boost to about 800hz or so. Of course this means using a tweeter with the cajones and fs that can handle crossing low. So I went thru quite a few, mostly looking at the specs, purchasing a few. For this first attempt, I did not want to spend a whole lot of money either.
So I gave the Tymphany dx25bg60 4ohm version a try. With its concave faceplate, it was a bit of a challenge to mount. We have that pretty well dialed in. Not long ago we acquired a very nice selection of Corian cutoffs and are using that for various fixtures and jigs.
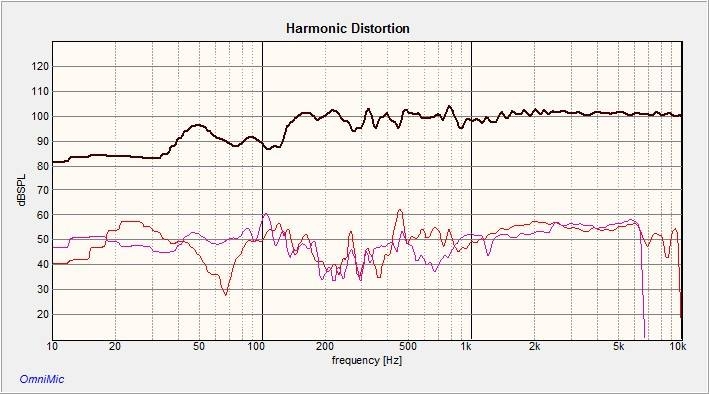
The woofer is a Dayton dsa270 in a mltl. Though I have not placed the batting or even added the port yet. The enclosure is just a big sealed unit in this test. Bass is still very strong to about 50hz or so. The final will have an fb of about 35 and f3 of 36 or there about. I'm pretty sure the lack of the port and fill is why I have the distortion spike at 500.
The sweeps here were taken at 100db @1m, on the tweeter axis I've adjusted the cross over a bit more and flattened out the dip at 1k as well.


Comments
Oh and I call them Veritas
We will be voicing them over the next few days. I will be getting the in room measurements and possibly a few outdoor ground plane measurements soon
Jason, the cabinets measure in at 22.5H 12.5W 19.5D. On the stands, they are about 43H. The MLTL has an fb of 30 and f3 of about 36. Still playing with the fill.
This may be something you already are aware of, but on the polar plot, if you really want to just show the directivity, all that needs to be done is to normalize the response plots to the on-axis response. This will remove the natural frequency response of the speaker from the equation, so the plot shows only the change in response as you move off-axis.
You don't need to remeasure anything, just load up the measurements in Omnimic, then select "normalize" and pick your on-axis measurement file. It will ask you what frequency to reference, which is basically setting what frequency becomes 0dB, for a full-range complete speaker this can be left at the default of 1kHz.
You will end up with a plot that looks like this, with no variation in colour at 0 deg, everything else is relative to that point: