I'd avoid adding blocks that would make the structure more ridged. Looks to me that the only cross grain gluing would be at the top and the bottom of the baffle and back. If you haven't glued the front baffle then a gasketed baffle would be great. Finishing does slow the moisture change in the wood.
I now have all the drivers installed with test wires running out the back. I decided to set up and test the woofer diffraction model first using the VituixCad diffraction and merger tools. Since VituixCad does not have the Allison equations built in, I decided to model this aspect using Jeff's BDBS spreadsheet. I then manually reduced the amount of BSC applied by 2.5dB to account for the fact that my woofers will only be 16 inches above the floor (with stands).
VituixCad diffraction model:
Here is the BDBS boundary gain model, showing the approx 2.5db power response gain in the 100-200Hz area produced by floor boundary at 16 inches. The axial response gain is even higher, but that is only at a spot distance of approx 96 inches.
VirtuixCad merger screen and output for full 6dB BSC model:
VirtuixCad merger screen and output for 3.5dB BSC model (reduced 2.5dB to account for floor gain). This is the model that I will be using to develop the xover.
@jhollander said:
Bill you're adding the baffle and boundary to a nearfield measurement? Not sure that makes sense above 1Khz.
Not sure I am following you. This is only the NF/FF woofer merge. Xover will be approx 700Hz and below. I'm adjusting the merged data to account for the floor boundary. Later on, I will be adjusting the SPL of the midrange and tweeter to match the woofer SPL in the 100-200Hz area. If I apply the full 6dB, the speaker will sound bass heavy, even when positioned well out into the room.
Room boundary inclusion below 1kHz doesn't make sense except for the floor, which for a floorstanding speaker with woofer at floor level, should be considered a constant. This low frequency interaction can be a real challenge, so hopefully I can provided a bit of assistance here. What you've done by simply bumping up the nearfield response a few dB is a good start, but there may be a better solution that provides a bit more accurate response shape.
The Boundary Reinforcement section of Jeff's old spreadsheet is really not different from the "reflection" section of VituixCAD diffraction model apart from the upward swoop of "room gain" which can be disregarded. As well, VituixCAD includes a "Room" section under the main tab for determining room modes on a complete system based on boundary proximity. The "issue" with the boundary reinforcement in Jeff's sheet is that it includes 3 boundaries, and you can see that the result varies wildly depending on the placement of the speaker in relation to those boundaries. For all intensive purpose, unless you are designing a permanent installation that will never move, room boundaries should not be included in the design data.
If you set 2 of the 3 boundaries in Jeff's sheet to zero, and just include the floor, you'll find the shape of the curve is not different from what you get in VituixCAD reflection model with a constant absorption factor, apart from the swoopy low frequency "room gain".
For an example of VituixCAD floor reflection model, Here I've overlaid the diffraction with and without the floor reflection enabled. With my absorption factor of 7dB, you can see there is some gain here at low frequency, which will be dependent on the value you choose for the absorption factor.
The problem with this simulation above is that the mic is located at woofer axis. We're not going to listen to this speaker while laying on the ground (most of the time), and the interaction of the floor reflection changes quite drastically at normal listening height. Bringing the mic up to listening height, the comparison of with and without floor reflection I think is fairly accurate:
Here there is still some low end boost from the floor, and the diffraction hump is quite a bit different shape from 200-1kHz. If this diffraction model is included with nearfield splice and far field measurement, you should end up with something that might need about 2dB of BSC which is what I ended up with and really liked in my design. Since the mic is rather off-axis now, the distance entered can have quite an effect as well, so I would run this simulation at your typical listening distance.
Thanks, dcibel. Good stuff. I'll have to read and re-read your post several times to make sure I understand what is going on here. So far, I have clicked around on VituixCad's floor reflection box on the diffraction screen without success. I put in the 16" distance and it does not seem to be the same as the BDBS model at all. If I progressively reduce the woofer to floor distance in BDBS, for instance, from 16, then 15, then 14, then 13 inches, etc., I can clearly see the FR peaking up higher and higher in the 100 to 500Hz area. This does not seem to be the same in VituixCad. In VituixCad, the entire curve moves up and down uniformly. I'll double check my screens and try again. Maybe I have something out of place.
Let me clarify - When I said BDBS is really not different, I meant that it is simply a boundary reflection calculator. Looking at it closer today, I don't trust the result of Jeff's boundary simulator at all - where is the listening location in this simulation? I guess it is meant to be in line with the driver, but then the results don't make sense, and listening location in line with the driver doesn't make sensor for a floor level woofer evaluation. With a little trial and error, I find some agreement if I set a mic distance of 1m and listening height of 1m. Not very useful as I'm sure you don't listen at 1m, and BDBS doesn't seem to care about the mic distance entered for the diffraction simulation when it calculates the boundary reinforcement.
It can be shown easily in VituixCAD that these peaks and nulls move around quite drastically depending on where you listen. What I was trying to explain was how to use the floor reflection features in VituixCAD to get a fairly accurate depiction of the correct baffle diffraction requirement to include in the design data.
If you want to explore room modes further, it is easily done with the "room" tab in the VituixCAD main screen. You can start with just the default ideal flat response driver that is loaded on startup, draw a line to connect the source to the driver, then enter some values in the room section. Here you can observe easily where the peaks and nulls land in-room. For a completed system, it can provide a good depiction of the in-room response as if you were to simply place the mic in-room and measure ungated.
For an example in the room mode tool in VituixCAD, if you use the default driver, enter -600mm in the y axis, then in the room tab, enable floor reflection and set the floor at -1000mm and you'll see where the peaks an nulls land from floor interaction alone, with a woofer at 400mm off the floor (16in roughly).
@4thtry said:
If I progressively reduce the woofer to floor distance in BDBS, for instance, from 16, then 15, then 14, then 13 inches, etc., I can clearly see the FR peaking up higher and higher in the 100 to 500Hz area. This does not seem to be the same in VituixCad. In VituixCad, the entire curve moves up and down uniformly. I'll double check my screens and try again. Maybe I have something out of place.
Yup, that's it! I could not get it to work because I was entering the floor reflection distance as 414mm. Now I can see how it works. Thanks for the vid.
It doesn't give you a perfect depiction of the "boundary reinforcement" as you can see by moving the driver away from the floor, the low frequency gain that is shown doesn't go away, so there's still a bit of guesswork of what the right absorption factor is, and one would assume that if the driver is a decent distance from the boundary, that the diffraction sim would simply be completed without it as you would normally.
Here's something neat on the topic of reflection calculation. What is happening in VituixCAD is a "mirror image" calculation. If you draw the baffle as a mirror image with two woofers, you will get the same result as including the floor reflection, but with 0dB absorption. So you really can think of acoustic reflection like a mirror on the wall (err...floor).
Ya, I guess the boundary reinforcement section of BDBS does not include a mic position at all. All you can do is enter three distances: Floor, and 2 walls. There is a button that clicks back and forth between "Power Response" and "Axial Response". I used the power response button in my calculations above. I suppose it does give you an idea of the average gain throughout the room. When it comes to lower frequencies, there are so many wild peaks and dips that it is probably best to use averages.
Exactly right, at low frequencies there will be some wild peaks and dips from boundary interference, which will vary by speaker and listener location, so best addressed with EQ, or multiple subwoofers.
It's from 1974, I'm no mathematician but it's obviously some form of boundary interaction, but based on overall power response. It is missing some information for in-room power response since it is only considering immediate boundaries and not room modes from the rear walls, interaction from other drivers in other locations, etc. The paper suggests that interaction from other boundaries will not have a meaningful effect on in-room power response, which I'm not sure I agree with. It's interesting, but I'm not sure there' much value in it today when in-room measurements can be done quite easily these days.
One thing that I think the room calculation in Vituix could benefit from is the rear wall, so that it can calculate the room modes at low frequency in addition to the reflections.
I debated for a while as to whether or not I should post this, because my methods and/or calculations could be in error. But, I decided to go ahead and post it anyhow, because I think this actually works.
I am using OmniMic, which is a single channel measurement mic. I plan to replace this mic and set up a better 2 channel system, but that is still a work in progress. Yet, for the time being, I wanted to be able to measure and enter off-axis data in VituixCAD.
So, I have a nice DIY type polar table set up and I can physically take all the necessary measurements, but the problem is that VituixCAD only has provisions for one set of modeling delay offsets per driver. Yet, when you spin the polar table to take off-axis measurements using OmniMic, the modeling delay offsets change for each polar angle position. Off-axis FRD's, therefore, cannot be directly entered into Vcad when using OmniMic.
If, however, I take multiple measurements at each angle, then it is possible to calculate and correct the error at each angle by normalizing each angle to the on-axis polar angle. I can then load all the polar angle FRD's into VituixCAD and simply use the same "on-axis" delay value to cover ALL polar angles. The results should be completely accurate.
To set this up, I took 5 measurements per angle from 0 to 180 degrees in 15 degree increments (a total of 65 measurements). The 5 measurements per angle were the standard T, M, W, T+M, and M+W type measurements necessary to calculate modeling delay offsets. I loaded all this data into VituixCAD's time alignment tool to calculate the delays and then entered this into a spreadsheet (attached). I then used VituixCAD's calculator tool to normalize each polar angle measurement by adding the appropriate delay to each tweeter and woofer polar angle FRD measurement. Since I was using the midrange as the "anchor" in my model, no time adjustments were made to the midrange FRD's. I then used VituixCAD's merger tool to merge my NF+FF+Diffraction model to each of the time adjusted woofer FRD's. It seems to working out just fine. Here are a few screen shots of my xover model so far.
Time delay adjustment spreadsheet:
Tweeter and woofer driver FRD entry screens, showing one time delay entry per driver:
Wow, that must have been tedious! You will definitely have a sigh of relief when you get a standard XLR mic and can complete the same task without all this madness
What you've done sounds okay, I believe we even spoke of this process at the start of this thread. I'm not sure about the "normalized" correction table, but I have both an Omnimic and 2-channel rig so I can take a couple example measurements in the coming days to verify that this process does indeed work (or not), for verification and for anyone else that wants to subject themselves to it.
What is a bit confusing to me is the angles you have listed above. I'm assuming that by measuring from 0 to 180 degrees, you have measured from 0 deg = fully in front of the speaker, to 180 degrees being fully behind the speaker? That would be correct for proper calculation of the power & DI charts, but the angles entered into your spreadhseet and VituixCAD are not. You should be treating all angles as 0 to 180 degrees as positive numbers. Above you have 270 degree file entered at -90 degrees, and 285 degree file loaded as -75 degrees, etc which is quite odd.
The process took me roughly 1 hour to make all the measurements plus an additional 2 hours to fill out the spreadsheet and then correct all the FRD files. Three hours total; not too bad! I'll have to re-do my measurements, however, because the 180 degree arc I used was completely in front of my speaker. The 270 degree angle was actually -90 degrees, as shown in your diagram. I entered the value as 270 degrees and then VituixCAD automatically changed this to -90 degrees in the "Hor" column. This would be the correct value.
Ok, things are making more sense now. As far as designing a crossover goes, you probably won't see much extra information in the rear 90 -180 degree data, but it is required if you want a proper representation of the power & DI charts (the extra rear response data will affect the slope of the plots, but not necessarily the overall shape too much.
The question I would raise, is that half of your measurements should be duplicates. Essentially you have done twice as much work as you needed to, since your speaker is symmetrical, so +15deg should be the same measurement as -15deg. Your spreadsheet however shows 3-5mm of error between the + and - measurements depending on the specific measurement you look at, but that probably just comes down to placement and things wiggling around as you take the measurements.
I'm just looking at this chart again, and my brain tells me that all the adjusted values in the bottom of this sheet have the sign backward. ie all the delays for the tweeter should be positive values, the tweeter delay must be adjusted by +25.81 to create 0 in the on-axis column.
@dcibel said:
Ok, things are making more sense now. As far as designing a crossover goes, you probably won't see much extra information in the rear 90 -180 degree data, but it is required if you want a proper representation of the power & DI charts (the extra rear response data will affect the slope of the plots, but not necessarily the overall shape too much.
The question I would raise, is that half of your measurements should be duplicates. Essentially you have done twice as much work as you needed to, since your speaker is symmetrical, so +15deg should be the same measurement as -15deg. Your spreadsheet however shows 3-5mm of error between the + and - measurements depending on the specific measurement you look at, but that probably just comes down to placement and things wiggling around as you take the measurements.
Correct. Half of my measurements were duplicates. I was very careful when I set up the speaker on the polar table, testing the rotation to make sure it was turning on an axis just slightly behind the tweeter's voice coil. But I could not get it perfect. There was a certain amount of axis "wobble" as I turned the table. After I ran the first set of measurements and wrote down these values, I considered re-positioning the speaker slightly and re-doing the measurements to see if I could eliminate the rotational wobble. But I decided to just go with what I had because it seemed very close and I was getting very good curve matches during the time alignment process. Also note that I actually did most of the time alignment calculations in XSim using the "get file" function because VituixCAD's time alignment screen was difficult to read due to the overlapping and unneeded individual FRD curves.
I'm just looking at this chart again, and my brain tells me that all the adjusted values in the bottom of this sheet have the sign backward. ie all the delays for the tweeter should be positive values, the tweeter delay must be adjusted by +25.81 to create 0 in the on-axis column.
Ok. Sorry for the confusion.
This is what happened. Based on the spreadsheet values, I originally concluded that I needed to adjust the tweeter files by +25.81 and the woofer files by -684 in VituixCAD. So I entered these values and developed the crossover. Then I began to wonder if I got it backwards and thought that I had better double check this to make sure it was working properly. So, I loaded the +25.61 and -684 into VituixCAD's driver screen and then loaded a set of adjusted (the ones with "add" in the filename) tweeter files into the driver screen. Then I loaded one of the reference M frd's as the 2nd driver. And I added one of the T+M frd's as the third driver. I then hooked the drivers directly to the amplifier in the crossover screen and checked the FR match. The files did not match using +25.61. But changing the delay to -25.61 (actually rounded to -26) produced a perfect match. Same thing happened when I tested the woofer frd's. +686 produced a perfect match in the system.
Sorry I'm not following what you're trying to describe.
My comment was simply that if we focus on the 0H column in your sheet, the tweeter is adjusted by +25.81 in order to get to zero in the correction table at the bottom. If we move over to the 15H column now, -18.44 + 25.81 is +7.37, not -7.37 that is shown.
Just a tip with VituixCAD, if you are wanting to shift the driver by a specific delay value, enter the delay in the driver tab, not as a z offset in the crossover.
All good. I'll try and make some time to take some measurements of my own later this week for comparison. Even after all the work involved in the delay calculations, there is still the issue that the mid and woofer are being measured at the tweeter axis (or was it the midrange axis here?), which is going to provide some error in the off-axis data, but maybe a fairly small error for a typical speaker? Tough call.
Thanks, dcibel! All of my measurements were made with the microphone 39" on axis with the tweeter, using the same amplifier volume level. OmniMic settings were sine sweep, blended, 5ms gate, 1/96th smoothing. Measurements were made in my "great room" which is fairly large with a vaulted ceiling leading to a loft area. The Mic tip was 44" above the carpeted floor. The vaulted ceiling is approx 8.5 feet above the top of the speaker, rear wall about 7 feet behind the speaker and side walls about 7 feet on one side and 9 feet on the other side.
@4thtry said:
Thanks, dcibel! All of my measurements were made with the microphone 39" on axis with the tweeter, using the same amplifier volume level. OmniMic settings were sine sweep, blended, 5ms gate, 1/96th smoothing. Measurements were made in my "great room" which is fairly large with a vaulted ceiling leading to a loft area. The Mic tip was 44" above the carpeted floor. The vaulted ceiling is approx 8.5 feet above the top of the speaker, rear wall about 7 feet behind the speaker and side walls about 7 feet on one side and 9 feet on the other side.
All good, except at the distances you've listed, VituixCAD suggests a window of 4.23ms to avoid the floor reflection coming through in the measurements. It should be fairly clear in the impulse response in the Omnimic software.
Spreadsheet is much less confusing now, I hope that you didn't have to redo the delay values in all your measured data.
I just attempted to take OmniMic measurements from +90 to +180 and discovered that OmniMic cannot accurately measure horizontal polars beyond about 105 degrees. Beyond that, OmniMic cannot get a lock on the phase curve and the impulse response turns into garbage. I tried reducing the window gating from 5ms to 4ms, but that did not help. I reduced the gate to 3, then 2, 1, .5, etc., but that did not help either. I also tried turning the gating off completely. The result is that when I attempt to time align the resulting FRD files, I cannot match up the curves to determine an offset value. The phase data is completely messed up and unusable.
Yeah, the problem with Omnimic is that it is using peak detection of the impulse to determine the start of the FFT window. Once you start measuring around the rear of the speaker, you will have room reflections that are higher amplitude than the signal from the speaker facing away from the mic so it starts having some trouble with that.
So I did some quick and dirty measurements this morning. I only did 0 deg, 30deg, and 60deg as a test, and by the time alignment calculator made some adjustments of +6mm at 30 degrees, and -5mm at 60 degrees.
The comparison on power response of including the delay or not is pretty much negligible for this basic test. @4thtry I suppose you could do the same test with your data set, load into VituixCAD unmodified vs with all the individual calculated delays included, and see how much the power and DI graph is changed, if at all.
I did another test and simply modified the off-axis delays by more extreme values, and certainly the phase relations here do affect the overall power response, but a couple mm one way or the other through the off-axis measurements isn't going to throw things off by a real meaningful amount.
My thoughts here is that the individual delay of the off-axis angles is not quite as important here, as being able to create the 3D baloon of data data around each driver, measure each driver on it's own axis fully, and doing so with a 2 channel configuration simplifies the entire process maintaining correct phase relation at all angles without any effort at all. The only effort required for the 2 channel measurement is to keep a constant distance from mic to baffle for all measurements.
You may find that creating the baloon of data measured only at tweeter axis with min phase response, and delay calculated at on-axis angle only provides a "better than nothing" result, as long as you have understanding of the shortcomings of that information.
Comments
I'd avoid adding blocks that would make the structure more ridged. Looks to me that the only cross grain gluing would be at the top and the bottom of the baffle and back. If you haven't glued the front baffle then a gasketed baffle would be great. Finishing does slow the moisture change in the wood.
I now have all the drivers installed with test wires running out the back. I decided to set up and test the woofer diffraction model first using the VituixCad diffraction and merger tools. Since VituixCad does not have the Allison equations built in, I decided to model this aspect using Jeff's BDBS spreadsheet. I then manually reduced the amount of BSC applied by 2.5dB to account for the fact that my woofers will only be 16 inches above the floor (with stands).
VituixCad diffraction model:
Here is the BDBS boundary gain model, showing the approx 2.5db power response gain in the 100-200Hz area produced by floor boundary at 16 inches. The axial response gain is even higher, but that is only at a spot distance of approx 96 inches.
VirtuixCad merger screen and output for full 6dB BSC model:
VirtuixCad merger screen and output for 3.5dB BSC model (reduced 2.5dB to account for floor gain). This is the model that I will be using to develop the xover.
Bill you're adding the baffle and boundary to a nearfield measurement? Not sure that makes sense above 1Khz.
Not sure I am following you. This is only the NF/FF woofer merge. Xover will be approx 700Hz and below. I'm adjusting the merged data to account for the floor boundary. Later on, I will be adjusting the SPL of the midrange and tweeter to match the woofer SPL in the 100-200Hz area. If I apply the full 6dB, the speaker will sound bass heavy, even when positioned well out into the room.
Room boundary inclusion below 1kHz doesn't make sense except for the floor, which for a floorstanding speaker with woofer at floor level, should be considered a constant. This low frequency interaction can be a real challenge, so hopefully I can provided a bit of assistance here. What you've done by simply bumping up the nearfield response a few dB is a good start, but there may be a better solution that provides a bit more accurate response shape.
The Boundary Reinforcement section of Jeff's old spreadsheet is really not different from the "reflection" section of VituixCAD diffraction model apart from the upward swoop of "room gain" which can be disregarded. As well, VituixCAD includes a "Room" section under the main tab for determining room modes on a complete system based on boundary proximity. The "issue" with the boundary reinforcement in Jeff's sheet is that it includes 3 boundaries, and you can see that the result varies wildly depending on the placement of the speaker in relation to those boundaries. For all intensive purpose, unless you are designing a permanent installation that will never move, room boundaries should not be included in the design data.
If you set 2 of the 3 boundaries in Jeff's sheet to zero, and just include the floor, you'll find the shape of the curve is not different from what you get in VituixCAD reflection model with a constant absorption factor, apart from the swoopy low frequency "room gain".
For an example of VituixCAD floor reflection model, Here I've overlaid the diffraction with and without the floor reflection enabled. With my absorption factor of 7dB, you can see there is some gain here at low frequency, which will be dependent on the value you choose for the absorption factor.
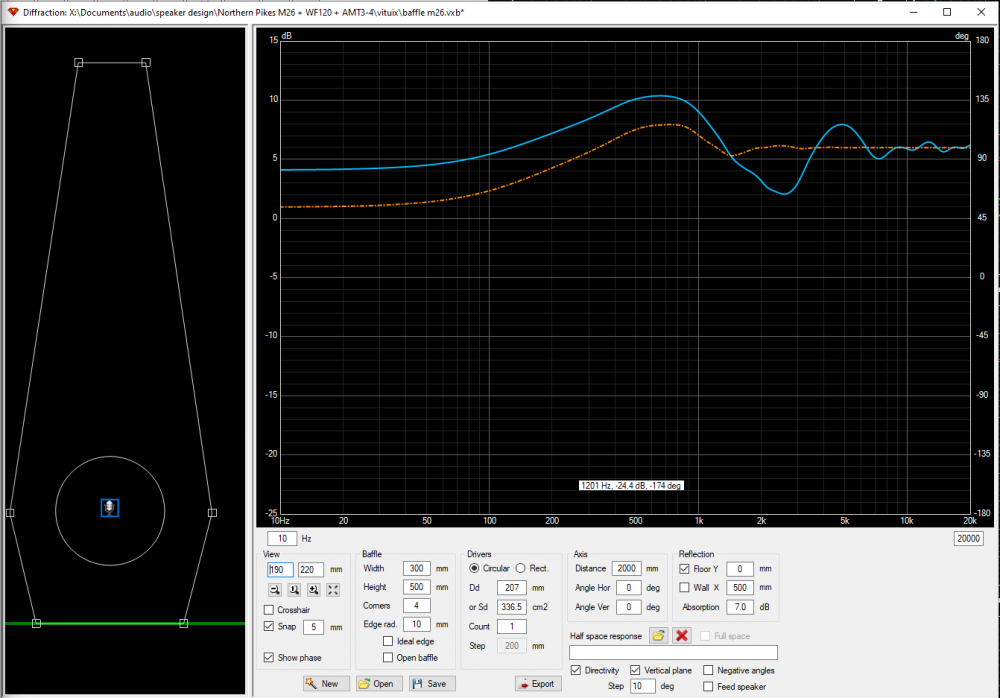
The problem with this simulation above is that the mic is located at woofer axis. We're not going to listen to this speaker while laying on the ground (most of the time), and the interaction of the floor reflection changes quite drastically at normal listening height. Bringing the mic up to listening height, the comparison of with and without floor reflection I think is fairly accurate:
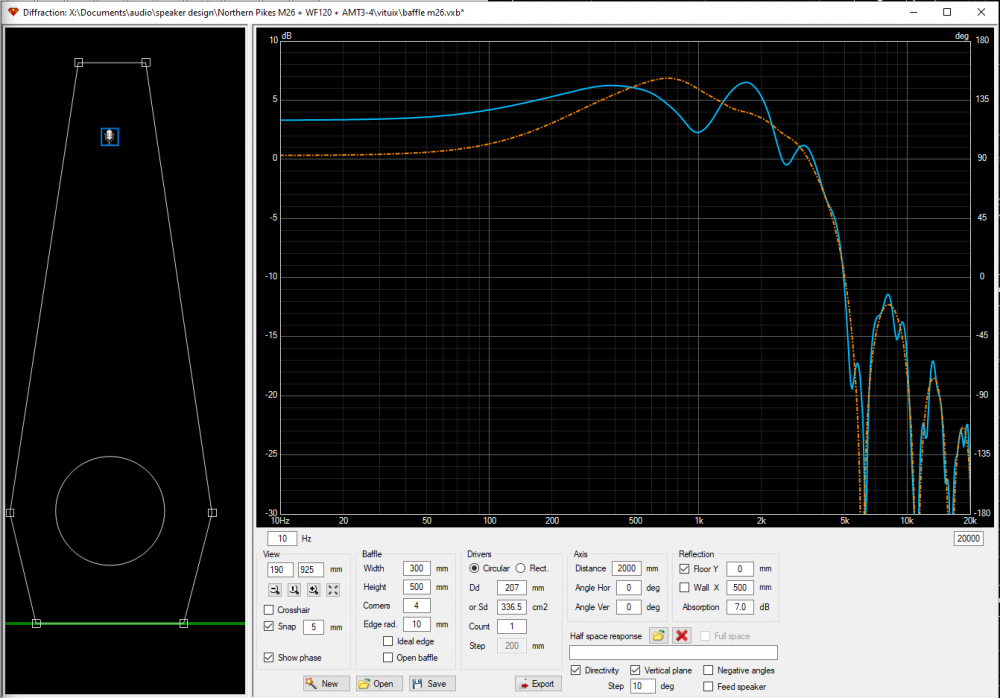
Here there is still some low end boost from the floor, and the diffraction hump is quite a bit different shape from 200-1kHz. If this diffraction model is included with nearfield splice and far field measurement, you should end up with something that might need about 2dB of BSC which is what I ended up with and really liked in my design. Since the mic is rather off-axis now, the distance entered can have quite an effect as well, so I would run this simulation at your typical listening distance.
OK I re-read it. It make more sense now. The baffle response was added to the nearfield and you reduced the scale dB in the second screen.
Thanks, dcibel. Good stuff. I'll have to read and re-read your post several times to make sure I understand what is going on here. So far, I have clicked around on VituixCad's floor reflection box on the diffraction screen without success. I put in the 16" distance and it does not seem to be the same as the BDBS model at all. If I progressively reduce the woofer to floor distance in BDBS, for instance, from 16, then 15, then 14, then 13 inches, etc., I can clearly see the FR peaking up higher and higher in the 100 to 500Hz area. This does not seem to be the same in VituixCad. In VituixCad, the entire curve moves up and down uniformly. I'll double check my screens and try again. Maybe I have something out of place.
Let me clarify - When I said BDBS is really not different, I meant that it is simply a boundary reflection calculator. Looking at it closer today, I don't trust the result of Jeff's boundary simulator at all - where is the listening location in this simulation? I guess it is meant to be in line with the driver, but then the results don't make sense, and listening location in line with the driver doesn't make sensor for a floor level woofer evaluation. With a little trial and error, I find some agreement if I set a mic distance of 1m and listening height of 1m. Not very useful as I'm sure you don't listen at 1m, and BDBS doesn't seem to care about the mic distance entered for the diffraction simulation when it calculates the boundary reinforcement.
It can be shown easily in VituixCAD that these peaks and nulls move around quite drastically depending on where you listen. What I was trying to explain was how to use the floor reflection features in VituixCAD to get a fairly accurate depiction of the correct baffle diffraction requirement to include in the design data.
If you want to explore room modes further, it is easily done with the "room" tab in the VituixCAD main screen. You can start with just the default ideal flat response driver that is loaded on startup, draw a line to connect the source to the driver, then enter some values in the room section. Here you can observe easily where the peaks and nulls land in-room. For a completed system, it can provide a good depiction of the in-room response as if you were to simply place the mic in-room and measure ungated.
For an example in the room mode tool in VituixCAD, if you use the default driver, enter -600mm in the y axis, then in the room tab, enable floor reflection and set the floor at -1000mm and you'll see where the peaks an nulls land from floor interaction alone, with a woofer at 400mm off the floor (16in roughly).
Is this what you mean?
https://drive.google.com/file/d/1oG-toitZYMMkPzneKYvNpR-x1HWaH80r/view?usp=sharing
Yup, that's it! I could not get it to work because I was entering the floor reflection distance as 414mm. Now I can see how it works. Thanks for the vid.
It doesn't give you a perfect depiction of the "boundary reinforcement" as you can see by moving the driver away from the floor, the low frequency gain that is shown doesn't go away, so there's still a bit of guesswork of what the right absorption factor is, and one would assume that if the driver is a decent distance from the boundary, that the diffraction sim would simply be completed without it as you would normally.
Here's something neat on the topic of reflection calculation. What is happening in VituixCAD is a "mirror image" calculation. If you draw the baffle as a mirror image with two woofers, you will get the same result as including the floor reflection, but with 0dB absorption. So you really can think of acoustic reflection like a mirror on the wall (err...floor).
Ya, I guess the boundary reinforcement section of BDBS does not include a mic position at all. All you can do is enter three distances: Floor, and 2 walls. There is a button that clicks back and forth between "Power Response" and "Axial Response". I used the power response button in my calculations above. I suppose it does give you an idea of the average gain throughout the room. When it comes to lower frequencies, there are so many wild peaks and dips that it is probably best to use averages.
Exactly right, at low frequencies there will be some wild peaks and dips from boundary interference, which will vary by speaker and listener location, so best addressed with EQ, or multiple subwoofers.
I found this document which I assume is the where the "Allison Effect" come from:
https://audioroundtable.com/misc/Influence_of_Room_Boundaries.pdf
It's from 1974, I'm no mathematician but it's obviously some form of boundary interaction, but based on overall power response. It is missing some information for in-room power response since it is only considering immediate boundaries and not room modes from the rear walls, interaction from other drivers in other locations, etc. The paper suggests that interaction from other boundaries will not have a meaningful effect on in-room power response, which I'm not sure I agree with. It's interesting, but I'm not sure there' much value in it today when in-room measurements can be done quite easily these days.
One thing that I think the room calculation in Vituix could benefit from is the rear wall, so that it can calculate the room modes at low frequency in addition to the reflections.
I debated for a while as to whether or not I should post this, because my methods and/or calculations could be in error. But, I decided to go ahead and post it anyhow, because I think this actually works.
I am using OmniMic, which is a single channel measurement mic. I plan to replace this mic and set up a better 2 channel system, but that is still a work in progress. Yet, for the time being, I wanted to be able to measure and enter off-axis data in VituixCAD.
So, I have a nice DIY type polar table set up and I can physically take all the necessary measurements, but the problem is that VituixCAD only has provisions for one set of modeling delay offsets per driver. Yet, when you spin the polar table to take off-axis measurements using OmniMic, the modeling delay offsets change for each polar angle position. Off-axis FRD's, therefore, cannot be directly entered into Vcad when using OmniMic.
If, however, I take multiple measurements at each angle, then it is possible to calculate and correct the error at each angle by normalizing each angle to the on-axis polar angle. I can then load all the polar angle FRD's into VituixCAD and simply use the same "on-axis" delay value to cover ALL polar angles. The results should be completely accurate.
To set this up, I took 5 measurements per angle from 0 to 180 degrees in 15 degree increments (a total of 65 measurements). The 5 measurements per angle were the standard T, M, W, T+M, and M+W type measurements necessary to calculate modeling delay offsets. I loaded all this data into VituixCAD's time alignment tool to calculate the delays and then entered this into a spreadsheet (attached). I then used VituixCAD's calculator tool to normalize each polar angle measurement by adding the appropriate delay to each tweeter and woofer polar angle FRD measurement. Since I was using the midrange as the "anchor" in my model, no time adjustments were made to the midrange FRD's. I then used VituixCAD's merger tool to merge my NF+FF+Diffraction model to each of the time adjusted woofer FRD's. It seems to working out just fine. Here are a few screen shots of my xover model so far.
Time delay adjustment spreadsheet:
Tweeter and woofer driver FRD entry screens, showing one time delay entry per driver:
Wow, that must have been tedious! You will definitely have a sigh of relief when you get a standard XLR mic and can complete the same task without all this madness")
What you've done sounds okay, I believe we even spoke of this process at the start of this thread. I'm not sure about the "normalized" correction table, but I have both an Omnimic and 2-channel rig so I can take a couple example measurements in the coming days to verify that this process does indeed work (or not), for verification and for anyone else that wants to subject themselves to it.
What is a bit confusing to me is the angles you have listed above. I'm assuming that by measuring from 0 to 180 degrees, you have measured from 0 deg = fully in front of the speaker, to 180 degrees being fully behind the speaker? That would be correct for proper calculation of the power & DI charts, but the angles entered into your spreadhseet and VituixCAD are not. You should be treating all angles as 0 to 180 degrees as positive numbers. Above you have 270 degree file entered at -90 degrees, and 285 degree file loaded as -75 degrees, etc which is quite odd.
This image should help:
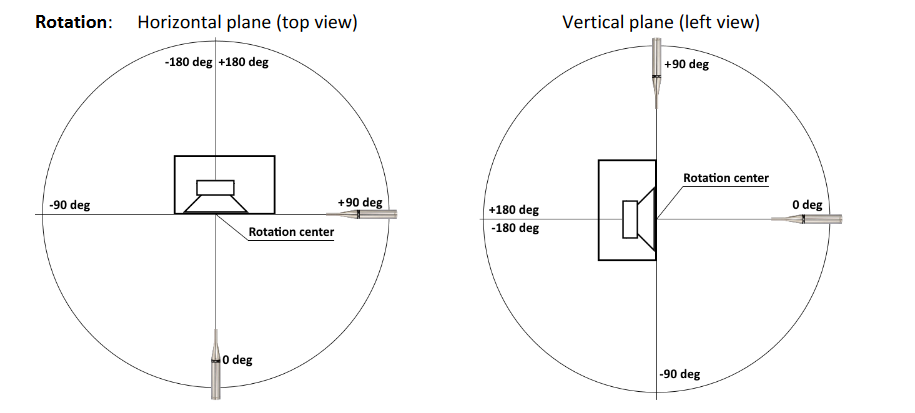
The process took me roughly 1 hour to make all the measurements plus an additional 2 hours to fill out the spreadsheet and then correct all the FRD files. Three hours total; not too bad! I'll have to re-do my measurements, however, because the 180 degree arc I used was completely in front of my speaker. The 270 degree angle was actually -90 degrees, as shown in your diagram. I entered the value as 270 degrees and then VituixCAD automatically changed this to -90 degrees in the "Hor" column. This would be the correct value.
Ok, things are making more sense now. As far as designing a crossover goes, you probably won't see much extra information in the rear 90 -180 degree data, but it is required if you want a proper representation of the power & DI charts (the extra rear response data will affect the slope of the plots, but not necessarily the overall shape too much.
The question I would raise, is that half of your measurements should be duplicates. Essentially you have done twice as much work as you needed to, since your speaker is symmetrical, so +15deg should be the same measurement as -15deg. Your spreadsheet however shows 3-5mm of error between the + and - measurements depending on the specific measurement you look at, but that probably just comes down to placement and things wiggling around as you take the measurements.
I'm just looking at this chart again, and my brain tells me that all the adjusted values in the bottom of this sheet have the sign backward. ie all the delays for the tweeter should be positive values, the tweeter delay must be adjusted by +25.81 to create 0 in the on-axis column.
Correct. Half of my measurements were duplicates. I was very careful when I set up the speaker on the polar table, testing the rotation to make sure it was turning on an axis just slightly behind the tweeter's voice coil. But I could not get it perfect. There was a certain amount of axis "wobble" as I turned the table. After I ran the first set of measurements and wrote down these values, I considered re-positioning the speaker slightly and re-doing the measurements to see if I could eliminate the rotational wobble. But I decided to just go with what I had because it seemed very close and I was getting very good curve matches during the time alignment process. Also note that I actually did most of the time alignment calculations in XSim using the "get file" function because VituixCAD's time alignment screen was difficult to read due to the overlapping and unneeded individual FRD curves.
Ok. Sorry for the confusion.
This is what happened. Based on the spreadsheet values, I originally concluded that I needed to adjust the tweeter files by +25.81 and the woofer files by -684 in VituixCAD. So I entered these values and developed the crossover. Then I began to wonder if I got it backwards and thought that I had better double check this to make sure it was working properly. So, I loaded the +25.61 and -684 into VituixCAD's driver screen and then loaded a set of adjusted (the ones with "add" in the filename) tweeter files into the driver screen. Then I loaded one of the reference M frd's as the 2nd driver. And I added one of the T+M frd's as the third driver. I then hooked the drivers directly to the amplifier in the crossover screen and checked the FR match. The files did not match using +25.61. But changing the delay to -25.61 (actually rounded to -26) produced a perfect match. Same thing happened when I tested the woofer frd's. +686 produced a perfect match in the system.
Sorry I'm not following what you're trying to describe.
My comment was simply that if we focus on the 0H column in your sheet, the tweeter is adjusted by +25.81 in order to get to zero in the correction table at the bottom. If we move over to the 15H column now, -18.44 + 25.81 is +7.37, not -7.37 that is shown.
Just a tip with VituixCAD, if you are wanting to shift the driver by a specific delay value, enter the delay in the driver tab, not as a z offset in the crossover.
Got it! Looks like my brain was 180 degrees out of phase (brain fart)!")
All good. I'll try and make some time to take some measurements of my own later this week for comparison. Even after all the work involved in the delay calculations, there is still the issue that the mid and woofer are being measured at the tweeter axis (or was it the midrange axis here?), which is going to provide some error in the off-axis data, but maybe a fairly small error for a typical speaker? Tough call.
Thanks, dcibel! All of my measurements were made with the microphone 39" on axis with the tweeter, using the same amplifier volume level. OmniMic settings were sine sweep, blended, 5ms gate, 1/96th smoothing. Measurements were made in my "great room" which is fairly large with a vaulted ceiling leading to a loft area. The Mic tip was 44" above the carpeted floor. The vaulted ceiling is approx 8.5 feet above the top of the speaker, rear wall about 7 feet behind the speaker and side walls about 7 feet on one side and 9 feet on the other side.
Also, I revised the cell formulas in my spreadsheet so that it shows the proper sign for the correction table values:
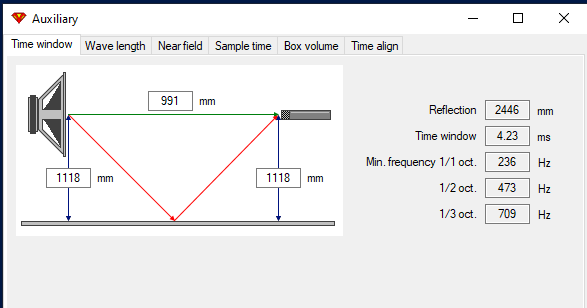
All good, except at the distances you've listed, VituixCAD suggests a window of 4.23ms to avoid the floor reflection coming through in the measurements. It should be fairly clear in the impulse response in the Omnimic software.
Spreadsheet is much less confusing now, I hope that you didn't have to redo the delay values in all your measured data.
I just attempted to take OmniMic measurements from +90 to +180 and discovered that OmniMic cannot accurately measure horizontal polars beyond about 105 degrees. Beyond that, OmniMic cannot get a lock on the phase curve and the impulse response turns into garbage. I tried reducing the window gating from 5ms to 4ms, but that did not help. I reduced the gate to 3, then 2, 1, .5, etc., but that did not help either. I also tried turning the gating off completely. The result is that when I attempt to time align the resulting FRD files, I cannot match up the curves to determine an offset value. The phase data is completely messed up and unusable.
Yeah, the problem with Omnimic is that it is using peak detection of the impulse to determine the start of the FFT window. Once you start measuring around the rear of the speaker, you will have room reflections that are higher amplitude than the signal from the speaker facing away from the mic so it starts having some trouble with that.
So I did some quick and dirty measurements this morning. I only did 0 deg, 30deg, and 60deg as a test, and by the time alignment calculator made some adjustments of +6mm at 30 degrees, and -5mm at 60 degrees.
The comparison on power response of including the delay or not is pretty much negligible for this basic test. @4thtry I suppose you could do the same test with your data set, load into VituixCAD unmodified vs with all the individual calculated delays included, and see how much the power and DI graph is changed, if at all.
I did another test and simply modified the off-axis delays by more extreme values, and certainly the phase relations here do affect the overall power response, but a couple mm one way or the other through the off-axis measurements isn't going to throw things off by a real meaningful amount.
My thoughts here is that the individual delay of the off-axis angles is not quite as important here, as being able to create the 3D baloon of data data around each driver, measure each driver on it's own axis fully, and doing so with a 2 channel configuration simplifies the entire process maintaining correct phase relation at all angles without any effort at all. The only effort required for the 2 channel measurement is to keep a constant distance from mic to baffle for all measurements.
You may find that creating the baloon of data measured only at tweeter axis with min phase response, and delay calculated at on-axis angle only provides a "better than nothing" result, as long as you have understanding of the shortcomings of that information.