Low end tuning is the same as Jeff Bagby's Quarks with an F3 of 100Hz. Measurement includes merged nearfield of woofer and port.
I noticed that your model includes merged NF woofer and port. Is that huge bulge at 85Hz in your model caused by the 7.5" distance between the driver and the wall? Just trying to understand the graphs a little bit better. Thanks.
Low end tuning is the same as Jeff Bagby's Quarks with an F3 of 100Hz. Measurement includes merged nearfield of woofer and port.
I noticed that your model includes merged NF woofer and port. Is that huge bulge at 85Hz in your model caused by the 7.5" distance between the driver and the wall?
No, this is quasi-anechoic. Jeff never posted measurements of the Quark design, just the drivers, xo schematic and cabinet details. I know people have been very satisfied with the Quarks so I was trying to keep that box modeling, and although they were not intended for use against a wall, but Jeff did design then for use on his desk as his PC speakers.
So I have the same box volume, port, and 1mh inductor as Jeff used and was using that as my starting point to use a different tweeter and try to bake in less BSC.
Hmm so that tells me I should probably add about 3db baffle step in my Faux Pas. They are almost there as-is up against the wall (and one in a corner), but still feel like they need a tad more to sound fully planted.
It would be nice if you could just take a large number of random SPL measurements around where you plan to put the loudspeaker, average the measurements into an overall power response curve, and then use that data to determine how to adjust your crossover for the flattest low frequency response. It is not just a matter of knowing how many dB's to apply. You also need to know where to apply them.
What's stopping you? Other than the fact that passive components for low frequency peak/notch will be big and expensive, so using EQ here will be cheaper and easier and flexible to being able to move speakers to a different room without redesign of passive filter.
@dcibel said:
What's stopping you? Other than the fact that passive components for low frequency peak/notch will be big and expensive, so using EQ here will be cheaper and easier and flexible to being able to move speakers to a different room without redesign of passive filter.
I'm just trying to figure out an easy way to do it. A couple weeks ago I experiemented with quickly averaging multiple measurements by using OmniMic's "new average" button as the sine wave was sweeping. Each time I clicked the left mouse button with the arrow hovering over the "new average" button, OmniMic folded the current measurement into a persistent average. So I mounted my computer mouse onto my microphone with gaffers tape. Then I walked around the speaker with the mic, randomly clicking the left mouse button, to generate a multi-mic average. It seemed to work very well. I can fold as many measurements into the average as I want. There is no limit. At this time, I am not sure if my results are repeatable. If I take a random 100 measurement average, will it give me the same curve as another random 100 measurement average. I do not know. That is my next test.
I’d recommend switching to REW, as the name suggests it's purpose built for this task. You can run the listening space average using RTA in a matter of seconds, and do it multiple times will show you how repeatable it is.
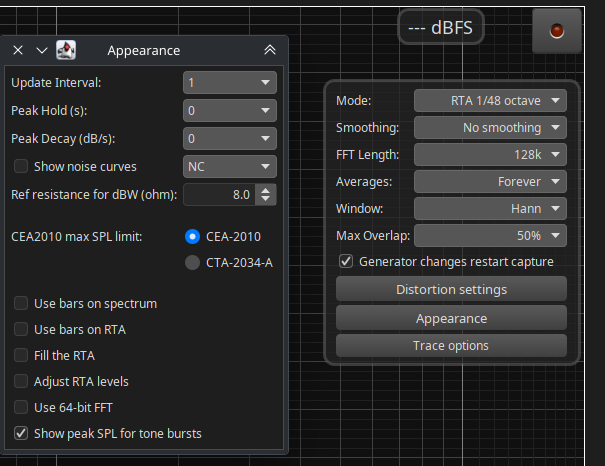
Open the RTA window in REW. Select the gear icon and configure it like this. It's important here that RTA mode is selected, not spectrum mode.
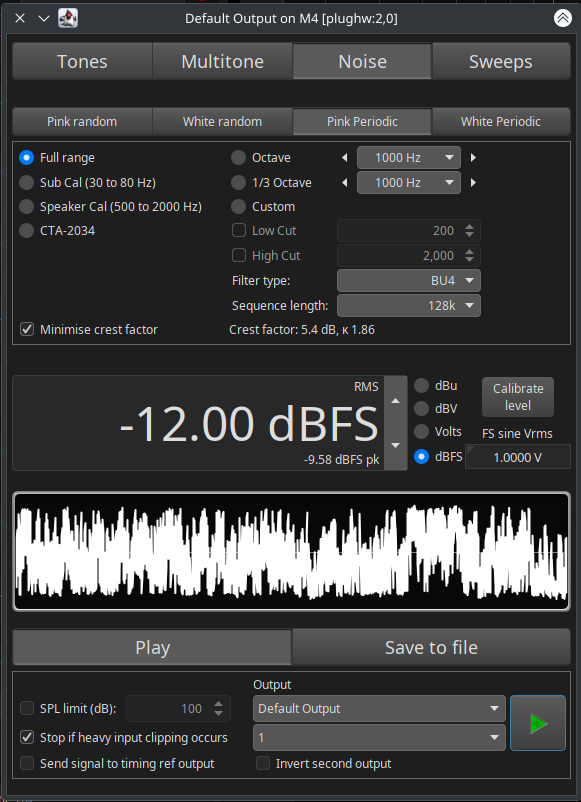
Open the Generator window. Select pink periodic noise. Note the sequence length is the same as the FFT length in the RTA window.
Now, hold your mic in your hand like it's a magic wand. Press play on the generator, and record on the RTA. Wave the wand around your listening area where your head is, make circles about 18" diameter. Move at a slowish but steady pace. You will see the RTA settle to a consistent shape after 30 or so averages. You can stop recording now.
Press the "save current" button on the RTA. In the "All SPL" tab of the main window, apply phychoacoustic smoothing.
Repeat this measurement process a few times if you like, just to see how repeatable this method is.
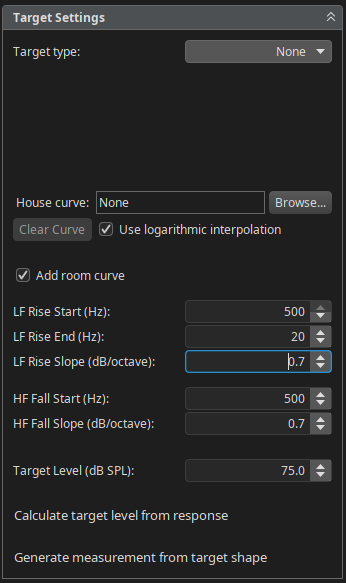
You have now created a room response, ready for EQ. "Flat" is not the target for this EQ. Recommend trying the REW default target of 1dB/oct slope below 200Hz, and 1.5dB/oct slope above 1000Hz. Alternatively, try a constant 0.7 - 1.2dB/oct slope for the entire frequency range.
Alternatively, you can take many individual measurement and average them in REW using "vector average" in the All SPL menu. You'll have the benefit of having a complete impulse response of each measurement for additional analysis of RT60 decay, waterfall, etc. which you won't get with RTA.
While I certainly appreciate the art of building pure passive designs (and seeing this groups' amazing and interesting builds), IMO DSP is just another tool (not unlike passive contour networks / shaping circuits...), and provides attractive options beyond pure passive.
As stated before, I've gone full-in to a hybrid approach to biamp (active btwn W and mid/tw, and passive for mid/tw), and DSP opens up, for me as a life-long Curious George, the opportunity to explore new box designs (horns, open backs, quasi vented/aperiodic TLs). I've always enjoyed the path of questioning the 'known truths' and the challenge of trying to find a better way to solve a problem. Most do fail, and are at best a learning experience.
I have a couple MiniDSP boards that I've played with. Quite fun actually to make instant changes to xo freq and slopes. But mine are only the cheapo 2 x 4 (not the HD verion). They are a bit noisy and such.
@dcibel said:
I’d recommend switching to REW, as the name suggests it's purpose built for this task. You can run the listening space average using RTA in a matter of seconds, and do it multiple times will show you how repeatable it is.
Thanks, dcibel! I saved your detailed post to a PDF and printed it out. Will download the latest REW and give this a try. Sounds much easier than my method of gaffer taping a mouse to my OmniMic.
@4thtry said:
Thanks, dcibel! I saved your detailed post to a PDF and printed it out. Will download the latest REW and give this a try. Sounds much easier than my method of gaffer taping a mouse to my OmniMic.
No prob. I should note with the settings I provided that I measure at 96kHz, so 128k sequence length is 1.3 seconds long (or 1.3 seconds per measurement). For Omnimic that only operates up to 48kHz, you may want to drop the sequence length to 64k, and FFT length in the RTA accordingly.
For visual learners of what @dcibel very nicely wrote- here’s the moving mic method as explained in a video by Charlie Sprinkle (Kali Audio, ex-JBL), using REW
John and Ben, you guys just accept whatever music your playing sounds as it does? Some music I listen to isn't always mixed or recorded well. EQ can really help things sound a lot better.
Yup, that's the way . Those guys in the video don't go into a lot of detail on the specific settings used in REW, and it's an old video with old software. So follow settings above and waive your mic around just like they do . I did post a longer FFT length above than what they're using to get as high as resolution as possible, so move slower, or decrease FFT length and move faster, up to you.
It looks like in the video they are using pink random noise, and EQing for flat. Not sure why they're not using periodic noise, it will just be more consistent, but with many averages probably just nitpicking...I would not be EQing for flat though, as mentioned above. You should find your speakers with "flat" designed on-axis will have a downward tilt to the response.
@6thplanet said:
John and Ben, you guys just accept whatever music your playing sounds as it does? Some music I listen to isn't always mixed or recorded well. EQ can really help things sound a lot better.
You know I have a bit of "compressed in red" recordings too, but for the most part, I don't have to EQ them to sound right.
Some music though I don't play in the living room much. Those my family doesn't much care for. I play them when home by myself or in the car. Funny thing about even those though, my EQ in the car is set to flat, just like the home system. Typically, I've found the issues that arise that make them sound bad are actually involved in driver distortion signature, spectral balance of the recording, or too loud playback levels. I have found speakers that don't like one album or another, but other speakers don't mind them. I just switch speakers.
I listen to all the bad recordings in my car. Hendrix and Zappa sound fine there.
In my basement listening room I go straight from DAC to power amp, so I can't EQ. That's probably a good thing as I've messed up some x-os with my old set up. I think I've learned a lot about good and bad recordings and compression in modern recordings.
Upstairs I will mess with the subwoofer gain which is always fun to see who I can annoy.
XO simulation software is pretty amazing if you eliminate user error.
Below is a simulated XO in VituixCAD and in magenta the measured speaker using REW. Pretty impressively close but a little off here and there.
Below that is fixing my errors. I actually used a 6 ohm resistor instead of 6.2 ohm and a 2 uf capacitor instead of 1.5 uf, because that is what I had on hand. I corrected the DCR to match my actual inductors. And I set listening distance in VituixCAD to 1m to match my actual mic distance. Dang!
@decibel - I saw your comment on diyaudio to Dave Fred to uncheck normalization on the polar plots. Do you have an image of a very good polar plot with the settings you recommend, maybe with a few points of what you are seeing that that makes it look "good" vs a poor polar plot, or even an okay polar plot but with bad display settings? I've wondered about the normalization on or off as well as the +/- 90 vs +/- 45 display options.
(Edit: By the way, I do know that a "smooth" transition from the low frequencies to the final directivity is good vs bad, but other than that generality I'm not sure what is an okay compromise if you can't get that to look ideal.)
@a4eaudio said: @decibel - I saw your comment on diyaudio to Dave Fred to uncheck normalization on the polar plots. Do you have an image of a very good polar plot with the settings you recommend, maybe with a few points of what you are seeing that that makes it look "good" vs a poor polar plot, or even an okay polar plot but with bad display settings? I've wondered about the normalization on or off as well as the +/- 90 vs +/- 45 display options.
Sure. My comment there on normalization is just "what do you want to see". Normalized plot will show the influence of driver directivity and cabinet diffraction only, without considering overall speaker response. This can be useful for evaluation of different drivers, location on baffle, horn/waveguide and baffle shape evaluation. For evaluation of overall speaker, complete response without normalization should be used however.
+/- 90 or 45 deg options are just there for convenience. I've never used 45 deg, but maybe useful for some corner loaded speaker where 45 deg is the complete radiation pattern. 90 deg option available just to utilize screen space if you only have 90 deg of response data. I generally keep to the full 180 deg view.
I usually just show the polar map with 3dB contours enabled, just like Dave shows. You will find after looking at power & DI and phase plots in conjunction with the polar map, is that the polar map is mostly duplication of information, however provides that extra layer of detail to highlight where problems are that you may want to focus on.
Dave's speaker provides a great example of a "good" power and polar response especially for an 8" 2-way. Overall power response has a fairly consistent slope, and similarly the horizontal polar map shows a fairly consistent shape. DI compares on-axis to power response, with a fairly benign lump at the crossover frequency, so overall the speaker is very good.
Vertical polar map will show an off-centre wiggle to the shape if driver phase is not aligned at the crossover frequency, so again it is sort of duplication of information, just a different presentation with a bit more detail. It will show exactly the angle where the off-axis nulls occur due to crossover frequency, slope, and driver separation.
A power response with a lump just above the crossover frequency will be typical for non-optimal 2-way, flat tweeter faceplate, poor choice of driver separation and crossover frequency, etc. will make that "mushroom" polar map, so you can easily correlate the power response chart to the polar map that way. Sharp baffle edges and poor choice of tweeter location on the baffle will produce a swing in DI slope, which again will be visible in the polar map.
(Edit: By the way, I do know that a "smooth" transition from the low frequencies to the final directivity is good vs bad, but other than that generality I'm not sure what is an okay compromise if you can't get that to look ideal.)
Every speaker is a balance, with baffle size, shape, driver separation distance, crossover frequency and slope all make some effect on overall outcome. Weigh all options against driver distortion characteristics to try and get the most out of what you have. For on-axis response I tend to focus more on the listening window response than on-axis, and some hints on crossover optimization previously, for example 50/50 weight of listening window to in-room response. That is my balance/compromise criteria.
So the whole purpose of the InDIYana them contest ("Tweeter Yoga") is to deal with the directivity of larger woofer and a tweeter limited in size (and thus mostly without waveguides). I placed two constraints on myself - I had to use drivers I had on hand and couldn't just do a straight-forward 8" two-way, so I am using the RS225-8 (8" aluminum) in an isobaric configuration.
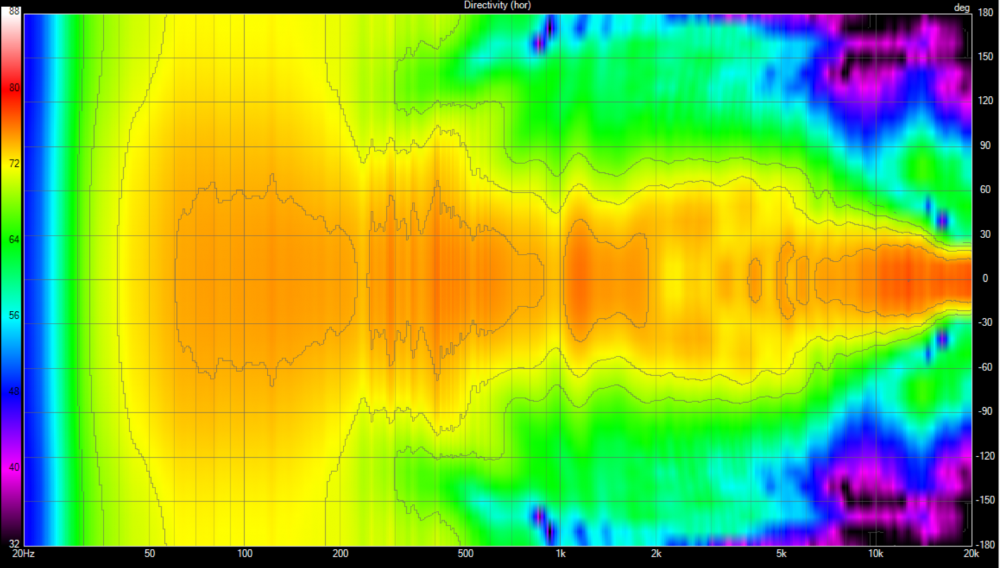
Base on figure 1 below, I think one conclusion is that this woofer simply becomes directional well below what a non-waveguided tweeter is going to be able to do. I have a good tweeter and can get down to 1.4 or even 1.2khz, but that is simply not enough. THUS, I simply will NOT be able to get a nice smooth/ideal directivity response. I might be able to get reasonable Listening Window and In-room Response, but the directivity line is going to have a hump around the xo point. Does that sound like an accurate conclusion?
Figures 2 and 3 show two different crossovers. Without saying anything else about the drivers or crossovers, what can you tell from Figure 2 vs Figure 3?
Comments
I noticed that your model includes merged NF woofer and port. Is that huge bulge at 85Hz in your model caused by the 7.5" distance between the driver and the wall? Just trying to understand the graphs a little bit better. Thanks.
No, this is quasi-anechoic. Jeff never posted measurements of the Quark design, just the drivers, xo schematic and cabinet details. I know people have been very satisfied with the Quarks so I was trying to keep that box modeling, and although they were not intended for use against a wall, but Jeff did design then for use on his desk as his PC speakers.
So I have the same box volume, port, and 1mh inductor as Jeff used and was using that as my starting point to use a different tweeter and try to bake in less BSC.
Yay, party speaker... Goes boom in the 50-100hz range perfect for head banging and chest thumping bass!
2db bump is also what I like to put in my active speaker centered around 80hz for extra oomph, passive no such shenanigans.
Hmm so that tells me I should probably add about 3db baffle step in my Faux Pas. They are almost there as-is up against the wall (and one in a corner), but still feel like they need a tad more to sound fully planted.
It would be nice if you could just take a large number of random SPL measurements around where you plan to put the loudspeaker, average the measurements into an overall power response curve, and then use that data to determine how to adjust your crossover for the flattest low frequency response. It is not just a matter of knowing how many dB's to apply. You also need to know where to apply them.
What's stopping you? Other than the fact that passive components for low frequency peak/notch will be big and expensive, so using EQ here will be cheaper and easier and flexible to being able to move speakers to a different room without redesign of passive filter.
Just use a steel laminate coil and get some slam.
InDIYana Event Website
I'm just trying to figure out an easy way to do it. A couple weeks ago I experiemented with quickly averaging multiple measurements by using OmniMic's "new average" button as the sine wave was sweeping. Each time I clicked the left mouse button with the arrow hovering over the "new average" button, OmniMic folded the current measurement into a persistent average. So I mounted my computer mouse onto my microphone with gaffers tape. Then I walked around the speaker with the mic, randomly clicking the left mouse button, to generate a multi-mic average. It seemed to work very well. I can fold as many measurements into the average as I want. There is no limit. At this time, I am not sure if my results are repeatable. If I take a random 100 measurement average, will it give me the same curve as another random 100 measurement average. I do not know. That is my next test.
I’d recommend switching to REW, as the name suggests it's purpose built for this task. You can run the listening space average using RTA in a matter of seconds, and do it multiple times will show you how repeatable it is.
Here's a quick rundown. Latest and greatest REW version as of today is here, it includes a LOT of new stuff and fixes:
https://www.avnirvana.com/threads/v5-20-14-early-access-build.11154/
Open the RTA window in REW. Select the gear icon and configure it like this. It's important here that RTA mode is selected, not spectrum mode.
Open the Generator window. Select pink periodic noise. Note the sequence length is the same as the FFT length in the RTA window.
Now, hold your mic in your hand like it's a magic wand. Press play on the generator, and record on the RTA. Wave the wand around your listening area where your head is, make circles about 18" diameter. Move at a slowish but steady pace. You will see the RTA settle to a consistent shape after 30 or so averages. You can stop recording now.
Press the "save current" button on the RTA. In the "All SPL" tab of the main window, apply phychoacoustic smoothing.
Repeat this measurement process a few times if you like, just to see how repeatable this method is.
You have now created a room response, ready for EQ. "Flat" is not the target for this EQ. Recommend trying the REW default target of 1dB/oct slope below 200Hz, and 1.5dB/oct slope above 1000Hz. Alternatively, try a constant 0.7 - 1.2dB/oct slope for the entire frequency range.
Alternatively, you can take many individual measurement and average them in REW using "vector average" in the All SPL menu. You'll have the benefit of having a complete impulse response of each measurement for additional analysis of RT60 decay, waterfall, etc. which you won't get with RTA.
Why are people so afraid of EQ?
I EQ stuff sometimes.
I think of it the same as tone controls and the bass boost lever on my old receivers, it's covering up flaws in the speaker design.
I agree. I try to make the speaker do what I want without EQ applied.
InDIYana Event Website
Assisting with room modes <500Hz is where EQ provides the most benefit.
While I certainly appreciate the art of building pure passive designs (and seeing this groups' amazing and interesting builds), IMO DSP is just another tool (not unlike passive contour networks / shaping circuits...), and provides attractive options beyond pure passive.
As stated before, I've gone full-in to a hybrid approach to biamp (active btwn W and mid/tw, and passive for mid/tw), and DSP opens up, for me as a life-long Curious George, the opportunity to explore new box designs (horns, open backs, quasi vented/aperiodic TLs). I've always enjoyed the path of questioning the 'known truths' and the challenge of trying to find a better way to solve a problem. Most do fail, and are at best a learning experience.
Probably because I don't own one?
I have a couple MiniDSP boards that I've played with. Quite fun actually to make instant changes to xo freq and slopes. But mine are only the cheapo 2 x 4 (not the HD verion). They are a bit noisy and such.
Thanks, dcibel! I saved your detailed post to a PDF and printed it out. Will download the latest REW and give this a try. Sounds much easier than my method of gaffer taping a mouse to my OmniMic.
No prob. I should note with the settings I provided that I measure at 96kHz, so 128k sequence length is 1.3 seconds long (or 1.3 seconds per measurement). For Omnimic that only operates up to 48kHz, you may want to drop the sequence length to 64k, and FFT length in the RTA accordingly.
For visual learners of what @dcibel very nicely wrote- here’s the moving mic method as explained in a video by Charlie Sprinkle (Kali Audio, ex-JBL), using REW
John and Ben, you guys just accept whatever music your playing sounds as it does? Some music I listen to isn't always mixed or recorded well. EQ can really help things sound a lot better.
Yup, that's the way . Those guys in the video don't go into a lot of detail on the specific settings used in REW, and it's an old video with old software. So follow settings above and waive your mic around just like they do
  . I did post a longer FFT length above than what they're using to get as high as resolution as possible, so move slower, or decrease FFT length and move faster, up to you.
It looks like in the video they are using pink random noise, and EQing for flat. Not sure why they're not using periodic noise, it will just be more consistent, but with many averages probably just nitpicking...I would not be EQing for flat though, as mentioned above. You should find your speakers with "flat" designed on-axis will have a downward tilt to the response.
You know I have a bit of "compressed in red" recordings too, but for the most part, I don't have to EQ them to sound right.
Some music though I don't play in the living room much. Those my family doesn't much care for. I play them when home by myself or in the car. Funny thing about even those though, my EQ in the car is set to flat, just like the home system. Typically, I've found the issues that arise that make them sound bad are actually involved in driver distortion signature, spectral balance of the recording, or too loud playback levels. I have found speakers that don't like one album or another, but other speakers don't mind them. I just switch speakers.
InDIYana Event Website
If your car isn't too old, it has already been EQ'd from the factory.
I listen to all the bad recordings in my car. Hendrix and Zappa sound fine there.
In my basement listening room I go straight from DAC to power amp, so I can't EQ. That's probably a good thing as I've messed up some x-os with my old set up. I think I've learned a lot about good and bad recordings and compression in modern recordings.
Upstairs I will mess with the subwoofer gain which is always fun to see who I can annoy.
XO simulation software is pretty amazing if you eliminate user error.
Below is a simulated XO in VituixCAD and in magenta the measured speaker using REW. Pretty impressively close but a little off here and there.
Below that is fixing my errors. I actually used a 6 ohm resistor instead of 6.2 ohm and a 2 uf capacitor instead of 1.5 uf, because that is what I had on hand. I corrected the DCR to match my actual inductors. And I set listening distance in VituixCAD to 1m to match my actual mic distance. Dang!
Awesome David!
@decibel - I saw your comment on diyaudio to Dave Fred to uncheck normalization on the polar plots. Do you have an image of a very good polar plot with the settings you recommend, maybe with a few points of what you are seeing that that makes it look "good" vs a poor polar plot, or even an okay polar plot but with bad display settings? I've wondered about the normalization on or off as well as the +/- 90 vs +/- 45 display options.
(Edit: By the way, I do know that a "smooth" transition from the low frequencies to the final directivity is good vs bad, but other than that generality I'm not sure what is an okay compromise if you can't get that to look ideal.)
Sure. My comment there on normalization is just "what do you want to see". Normalized plot will show the influence of driver directivity and cabinet diffraction only, without considering overall speaker response. This can be useful for evaluation of different drivers, location on baffle, horn/waveguide and baffle shape evaluation. For evaluation of overall speaker, complete response without normalization should be used however.
+/- 90 or 45 deg options are just there for convenience. I've never used 45 deg, but maybe useful for some corner loaded speaker where 45 deg is the complete radiation pattern. 90 deg option available just to utilize screen space if you only have 90 deg of response data. I generally keep to the full 180 deg view.
I usually just show the polar map with 3dB contours enabled, just like Dave shows. You will find after looking at power & DI and phase plots in conjunction with the polar map, is that the polar map is mostly duplication of information, however provides that extra layer of detail to highlight where problems are that you may want to focus on.
Dave's speaker provides a great example of a "good" power and polar response especially for an 8" 2-way. Overall power response has a fairly consistent slope, and similarly the horizontal polar map shows a fairly consistent shape. DI compares on-axis to power response, with a fairly benign lump at the crossover frequency, so overall the speaker is very good.
Vertical polar map will show an off-centre wiggle to the shape if driver phase is not aligned at the crossover frequency, so again it is sort of duplication of information, just a different presentation with a bit more detail. It will show exactly the angle where the off-axis nulls occur due to crossover frequency, slope, and driver separation.
A power response with a lump just above the crossover frequency will be typical for non-optimal 2-way, flat tweeter faceplate, poor choice of driver separation and crossover frequency, etc. will make that "mushroom" polar map, so you can easily correlate the power response chart to the polar map that way. Sharp baffle edges and poor choice of tweeter location on the baffle will produce a swing in DI slope, which again will be visible in the polar map.
Another example of very good overall response can be found in the example projects in the VituixCAD help:
https://kimmosaunisto.net/Software/VituixCAD/Epe-3W_demo.zip
https://kimmosaunisto.net/Software/VituixCAD/Kontiainen_demo.zip
Every speaker is a balance, with baffle size, shape, driver separation distance, crossover frequency and slope all make some effect on overall outcome. Weigh all options against driver distortion characteristics to try and get the most out of what you have. For on-axis response I tend to focus more on the listening window response than on-axis, and some hints on crossover optimization previously, for example 50/50 weight of listening window to in-room response. That is my balance/compromise criteria.
So the whole purpose of the InDIYana them contest ("Tweeter Yoga") is to deal with the directivity of larger woofer and a tweeter limited in size (and thus mostly without waveguides). I placed two constraints on myself - I had to use drivers I had on hand and couldn't just do a straight-forward 8" two-way, so I am using the RS225-8 (8" aluminum) in an isobaric configuration.
Base on figure 1 below, I think one conclusion is that this woofer simply becomes directional well below what a non-waveguided tweeter is going to be able to do. I have a good tweeter and can get down to 1.4 or even 1.2khz, but that is simply not enough. THUS, I simply will NOT be able to get a nice smooth/ideal directivity response. I might be able to get reasonable Listening Window and In-room Response, but the directivity line is going to have a hump around the xo point. Does that sound like an accurate conclusion?
Figures 2 and 3 show two different crossovers. Without saying anything else about the drivers or crossovers, what can you tell from Figure 2 vs Figure 3?
Figure 1: Raw Woofer (normalized)
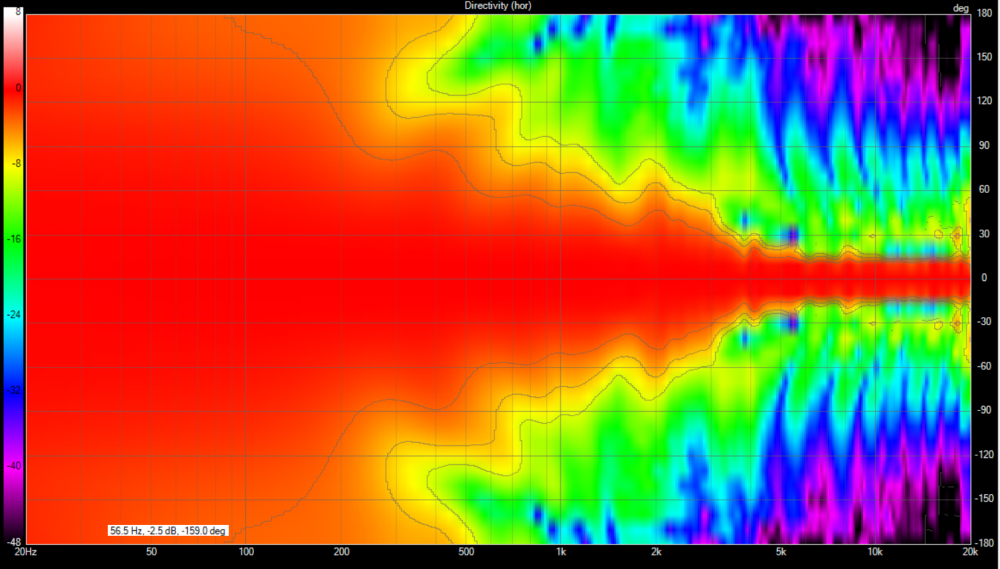
Figure 2: Crossover A
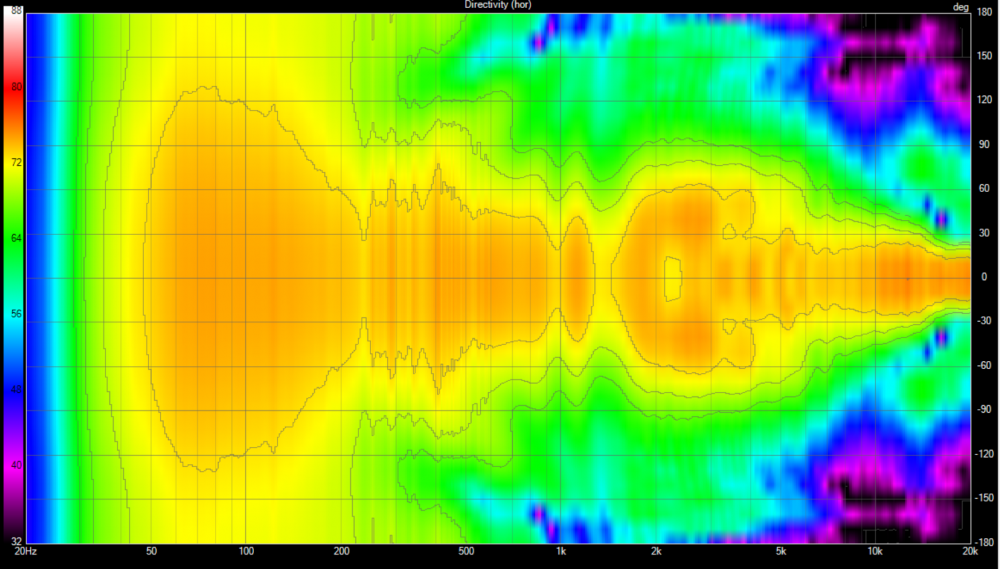
Figure 3: Crossover B
