8 coats of lacquer and I'm calling these cabinets done. Tomorrow I'll install all the drivers and see what they sound like in stereo. So far, I've only listened to one speaker playing mostly test tones.
@jhollander said:
Time to sell. I'm happy to take it off your hands.
1991 Tercel. No rust. 74k miles. Single owner (me). Purchased new in 1991 for $7700. Almost all miles are long trips (200 to 350 miles). Has original brake pads front and rear, which are almost new in appearance. Gets 35mpg on average and up to 40mpg on long trips. Car just sits in garage all winter; I take it out for a few joy rides each summer. I keep fresh oil in the crankcase at all times to prevent sludge buildup. I keep STA-BIL in the gas tank at all times. I keep the gas tank completely full and always put a bottle of ISO-HEAT in the gas tank over the winter months.
But sorry, John, not for sale. This is my backup car. I keep it licensed and insured 24/7/365. It is ready to go at all times (just put a new battery in it). If something goes wrong with my main car, I need to be able to jump into the backup and go.
@ugly_woofer said:
Is there some kind of a niche collectable value for old Toyotas like Beetles or Yugo's?
There probably is, but I have not checked into it. In Wisconsin, I can switch over to "collector car" licensing, but it is a huge one time payment with driving restrictions. For instance, you cannot operate a collector car on the highways during the month of January. Which would completely defeat my purpose of having an "always-ready-to-go" backup car.
In terms of value, the kelly blue book on this vehicle is probably "salvage." But if I had to replace this vehicle, that is the true value to me. All the major car companies have eliminated their <$20k vehicles (Hundai Accent, Chevy Spark, Nissan Virsa, Honda Civic, etc). The only <$20k vehicle left is the Mitsubishi Mirage, a 3 cyclinder with good mpg but no power. The 100% electric vehicles have limited range and cost way too much. And the hybrid electric vehicles cost way too much as well.
No. What if it takes me several weeks or even months to repair or replace my main vehicle? I want to be able to take my good natured time to decide what to do. And to go parts chasing multiple times if necessary. Having a backup vehicle that can be used for several weeks or months solves that problem. Uber would be a royal pain in the rear end, forcing me to make a quick decision to buy a new car that I don't really want.
@4thtry said:
I keep fresh oil in the crankcase at all times to prevent sludge buildup. I keep STA-BIL in the gas tank at all times.
OT rant ahead ...
The turdcel brings back bad memories for me.
In 40 years of driving, this is the only vehicle that had a catastrophic motor loss. We were commuting out of state for medical treatment for boy, and the motor started hammering. At the time, we couldn't afford to buy a handful of dirt and this 'Toyota's are indestructible' let us down. Pulled the motor out of a salvage vehicle and did the motor swap myself.
40k on the odo. Years later, we found out Toyota had an 'oil sludge' lawsuit on that motor. Allegedly, sludge would build up in the down spout from the head to the pan causing oil starvation.
FWIW, the old brown mule 'truck' has 240k, the suby has 180k, and the old Ranger gt had 260k when it was parked.
Never owned another Toyota. Never will.
Just another Toyolet I think I'll try a Korean car when my pos Nissan Altiturd is too costly or painful for me to repair myself. What a cheap ass design/build. Great mpg but that's about it. No wonder they have such a terrible resale value.
My previous car (before the Tercel) was a 1983 Toyota Starlet. It had 324,000+ miles on it when I pulled into the Nissan dealer and traded it off for my current Nissan Versa (2010). Engine still ran good, did not burn oil, but the car body was totally rusted out along the wheel wells and was in real danger of structural collapse. My co-workers called it the "harlot".
Changed oil/filter once per year. Pulled the transmission out myself two or three times, replaced input shaft, front main bearing, and seal. Replaced clutch, throw out bearing, and pressure plate once. Replaced alternator two or three times. Replaced thermostat several times. Replaced drive shaft U-joints two or three times (this was rear wheel drive). Replaced front and rear brake pads several times, replaced front rotors once. Replaced entire exhaust system several times. Car was alot of work to keep on the road, but very dependable, one of the best cars I have ever had. Got 44mpg on the highway. Very small car, easy to park and see out the huge rear window when backing up (unlike cars today, which have very small rear windows and therefore need rear cameras to see what is behind you).
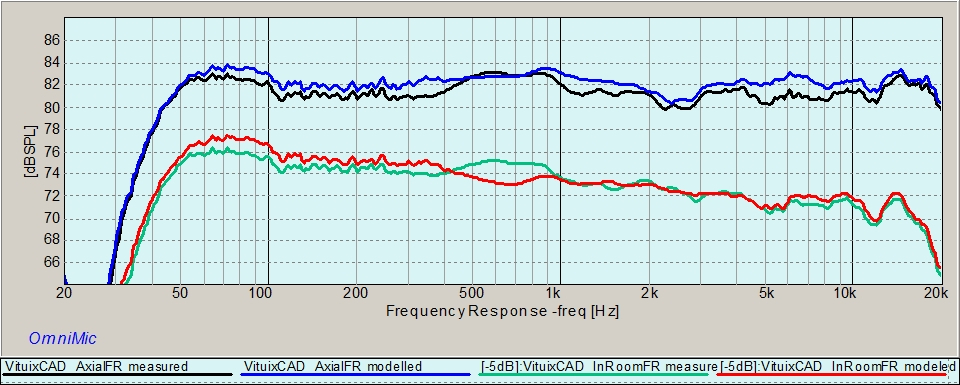
I ran up a complete set of spinorama measurements on the completed speaker. I used the same speaker that was used to create the VituixCAD model. All FR measurements were taken using the calibrated Sonarworks SoundID mic, dual channel Arta jig, and Soundeasy v20 (Easylab). Z measurements were taken with DATS V2. Here are some graphs showing how the model compares to the final measurements:
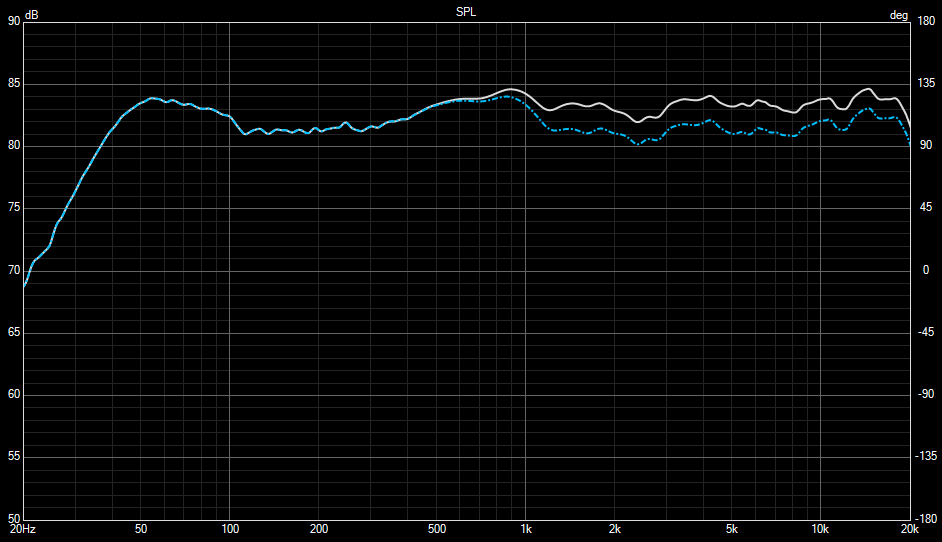
Axial FR modelled vs. measured. In Room FR modelled vs measured (offset 5dB for clarity)
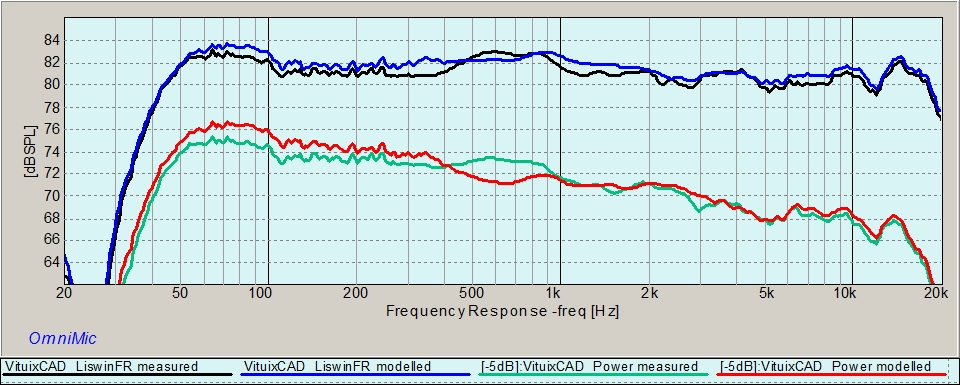
Listening Window FR modelled vs measured. Power Resp modelled vs. measured (offset 5dB for clarity)
@4thtry said:
I ran up a complete set of spinorama measurements on the completed speaker. I used the same speaker that was used to create the VituixCAD model. All FR measurements were taken using the calibrated Sonarworks SoundID mic, dual channel Arta jig, and Soundeasy v20 (Easylab). Z measurements were taken with DATS V2. Here are some graphs showing how the model compares to the final measurements:
Axial FR modelled vs. measured. In Room FR modelled vs measured (offset 5dB for clarity)
Listening Window FR modelled vs measured. Power Resp modelled vs. measured (offset 5dB for clarity)
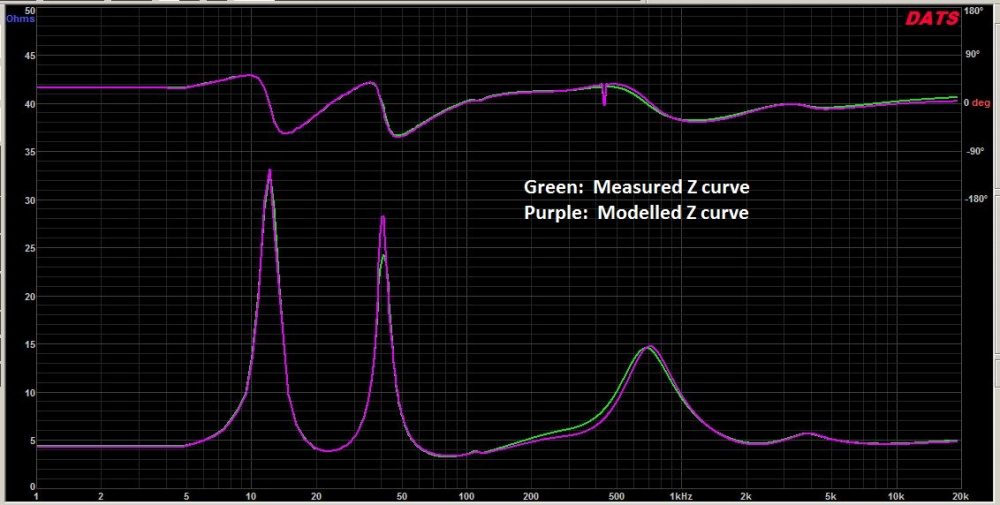
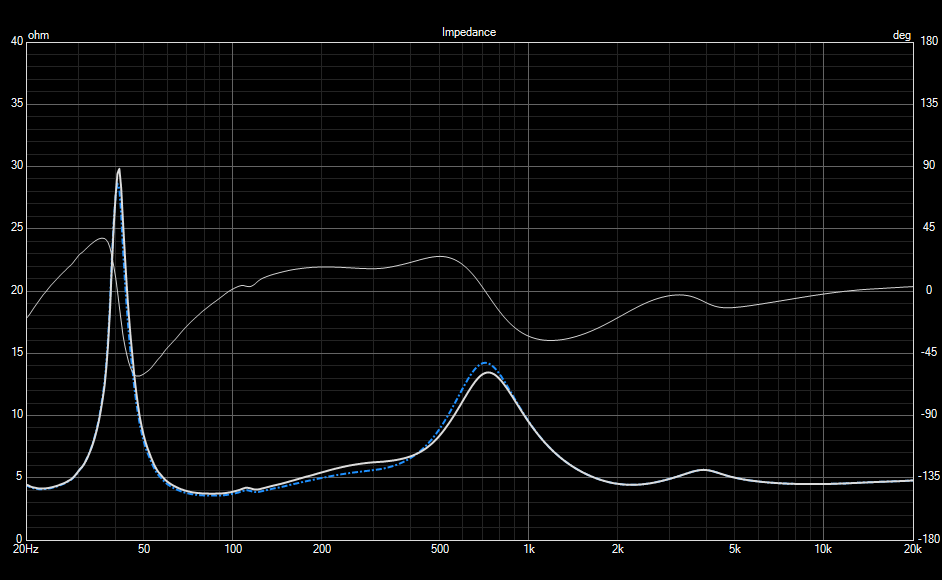
Modelled vs final measured impedance curve:
SoundEasy, DATS, VituixCAD, then displayed in Omnimic. You've got to throw ARTA into the mix somewhere just so you can utilize every software package you have
I would say your measurements have great agreement apart from 500-1kHz. FWIW If I take your "final" crossover posted here and apply it to the data I have for your drivers, I arrive at something that matches closely with your measurements, with a bit of a lump from 500Hz to 1kHz, but with 2dB difference in the low end. I would suspect the "error" lies in how the woofer response was re-processed, or simply in how the near and far field responses were spliced. The impedance difference around the same area might also indicate some error in part value in the woofer crossover, changing the 1.5ohm resistor to 2.2 ohm in the simulation creates about the same change to overall impedance, and creates a more "peaky" woofer response in that same frequency range.
For comparison, I simply traced your above on-axis measurement and compared to the simulation using the response data I have for your drivers (adjusted to 1m distance), and the final crossover as you posted. Orange dashed line is your measured response above.
Regardless, if you are happy with the sound of the speaker, that's what really matters. Enjoy!
Just another comparison to see whats the smallest change I can make for simulation to match your measurement. Adjusted woofer up by 2.5dB, and changed 1.5ohm to 2.2ohm in the woofer circuit. Hopefully this is helpful to nail down the difference between your sim and reality.
@tajanes said:
so your final Xover points ~600 and 2500 ?
My guesstimate would be 650 and 3500, depending on how you want to interpret the graphs. The mid has kind of a funny looking shelf in the 2.5-4k region, which makes it difficult to really say where the upper crossover point is happening. Target curve overlays would probably help me to see this a little bit better, but I have not done this.
@dcibel said:
Just another comparison to see whats the smallest change I can make for simulation to match your measurement. Adjusted woofer up by 2.5dB, and changed 1.5ohm to 2.2ohm in the woofer circuit. Hopefully this is helpful to nail down the difference between your sim and reality.
I think I know what is happening. When I merged NF woofer + diffraction model + FF woofer files, I applied 4dB (not 6dB) of BSC in the diffraction model. I did this to account for the fact that my woofers will be 17" (on center) from the floor. This proximity to the floor will boost the lower mid bass frequencies somewhat and I wanted to account for this in the model. So, in order to make this adjustment, I changed the "Axis distance" from 2500mm down to 600mm. This reduced the baffle step applied by 2dB. I did not enter anything in the floor or wall reflection fields, because those field only affect the response above 1kHz. I didn't care about the response above 1kHz, because that was being replaced by the FF woofer data. Only the change in the slope of the response below 1kHz was important for the model.
Also, this might have something to do with the 500-1kHz disagreement of the model verses my measurements. Not sure about that.
Also, when I did the final spinorama measurements, the microphone was 1 meter on axis to the tweeter for all measurements. The microphone was 72.5" above the floor for all measurements, so I was able to use a gate of 8.1ms. When I set up the original model, the drivers were each measured 1 meter on axis, but the distance from mic to floor varied, so I had to use a much shorter gate (approx 4.7ms).
Gate difference is okay and would be a very minor difference if any as long as nearfield and splice is done correctly for a reflection free response. For the comparisons I made above, all I did was adjust the listening distance to 1m and use the same response files that I generated from the raw measurements that you posted.
You can do the same, just right click on the SPL graph and "open overlay". You can hold shift and use the scroll wheel to adjust the SPL of the loaded overlay to get a perfect overlap.
@dcibel said:
Just another comparison to see whats the smallest change I can make for simulation to match your measurement. Adjusted woofer up by 2.5dB, and changed 1.5ohm to 2.2ohm in the woofer circuit. Hopefully this is helpful to nail down the difference between your sim and reality.
I just pulled the woofer out and double checked the 1.5 ohm resistor. It measures exactly 1.51 ohms on my ExTech meter (1.67 - 0.16 lead resistance). So the difference is probably due to NF/FF/Diff splicing error. I'll re-do my model splicing and see if that makes a difference.
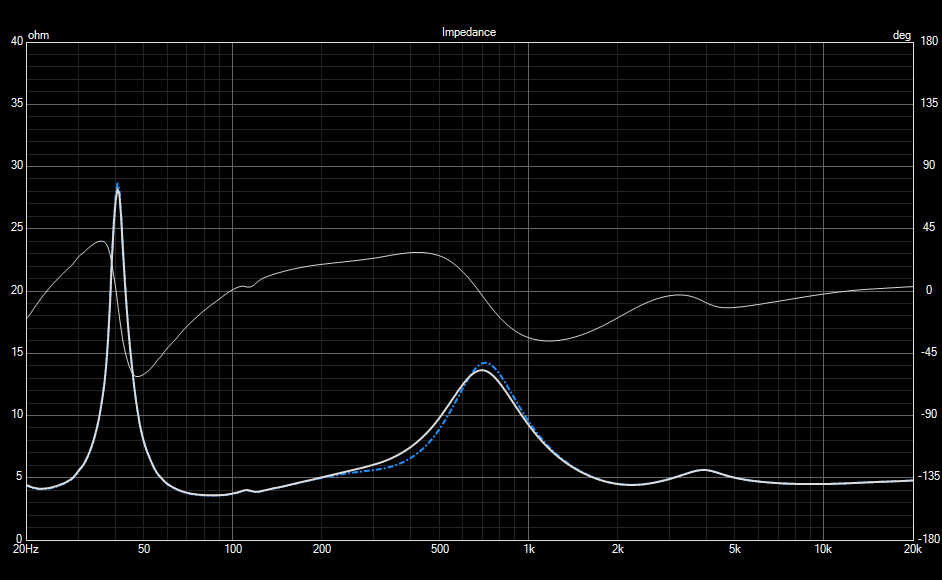
The suggestion for the 1.5 ohm resistor was based on your measured impedance vs sim. Could be the 120uF cap causing that error as well, but adjusting the resistor up to 2.2 ohm gave better agreement with your measurement, both in impedance and frequency response.
Focusing on impedance, comparison of 1.5 vs 2.2 ohm.
Comparison of 120uF vs 100uF, I think you can agree the resistor change looks more like your measurement.
Thanks, dcibel. Your analysis seems to fit the data well. I was thinking this over, and it seems to me that my modeled and measured curves should match perfectly below 400Hz, since both curves are the product of the same diffraction model. It looks like I messed up my comparison curves above, because I was assuming that my overall modeled and measured SPL levels were the same. But they were not. If you look closely at my posted comparison curves, it looks like my modeled curves have an overall 1dB higher SPL compared to my measured curves. Will fix and re-post them tomorrow morning.
The overall tonal balance is thick and heavy with lots of bass. This is with them mounted on my short stands (woofers 17" on center above the floor). I think I need to reduce the amount of bass below 400Hz or so. Sounds like I did not apply the correct amount of baffle step compensation, compared to many of my other speakers, which sound much more balanced.
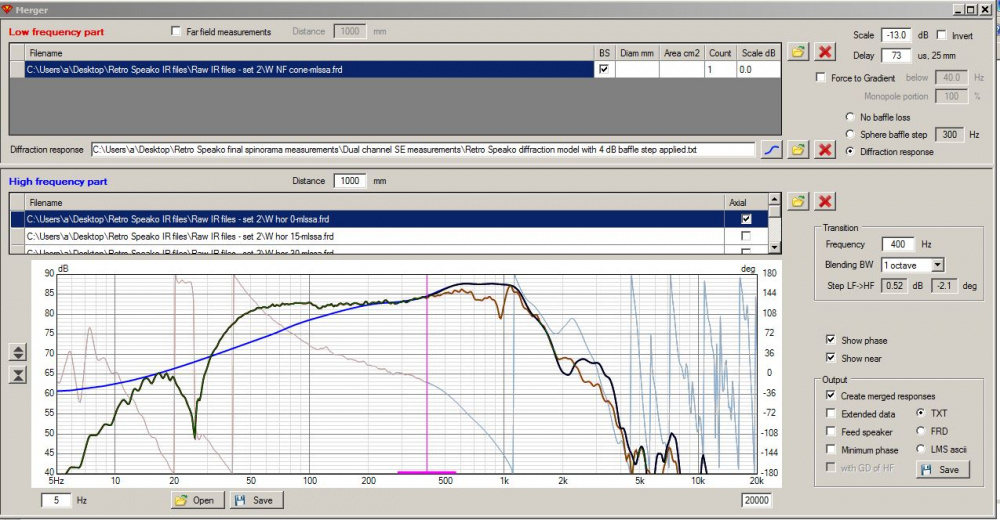
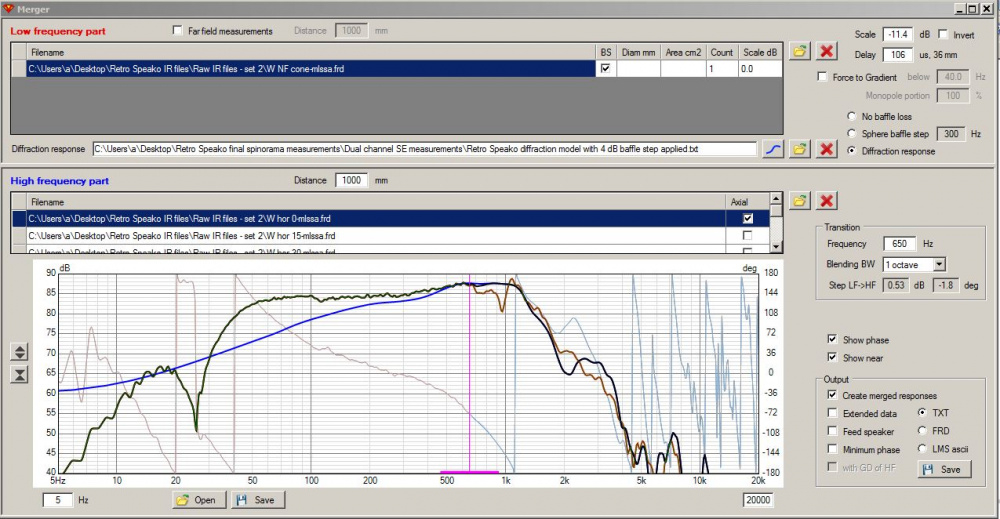
Here are the revised comparison curves. I adjusted the modelled curves down by 0.8dB, which results in an almost perfect match between modelled and measured below 400Hz. In looking at the 400-900Hz region, I was thinking that perhaps this difference is due to my using the wrong splicing frequency when I merged the NF/FF/Diff curves. I spliced at 400Hz. Maybe I should have spliced at about 650Hz. This higher splice frequency would have forced the two curves to match much better throughout the 400-900Hz region. Perhaps this is why they now sound a little bass heavy, because this very low splicing frequency pushed the low frequencies down too far in my model. Seems logical. Just speculating.
If you feel the sound as-is is a bit too bloated, here's what I would try:
-the 1.5 ohm resistor in the midrange circuit, remove it or just short it out.
-the 7.5 ohm resistor in the tweeter circuit is increased to 15 ohms
This change will lift everything >1kHz by about 2dB. Here's the before/after of the change (1m listening distance sim to match above comparison).
I did a comparison of a 400Hz splicing model verses a 650Hz splicing model. This produces an approx 2dB SPL change at 100Hz in the model. So, it looks like splicing at the appropriate frequency is critical when setting up your initial diffraction model.
@dcibel said:
If you feel the sound as-is is a bit too bloated, here's what I would try:
-the 1.5 ohm resistor in the midrange circuit, remove it or just short it out.
-the 7.5 ohm resistor in the tweeter circuit is increased to 15 ohms
This change will lift everything >1kHz by about 2dB. Here's the before/after of the change (1m listening distance sim to match above comparison).
Thanks for the suggestions. I snipped out the 1.5 ohm on the midrange and now the mids sound about right (Edit: poorly worded. Actually, I shorted out the 1.5 ohm resistor on the midrange). I paralleled a 10 ohm across the tweeter's 4 ohm series resistor and the extreme highs were just a tad too bright (splashy, sibilant). I will try replacing the 7.5 ohm with 15 to see how that sounds. Will also try a 15 ohm paralleled across the 4 ohm (leaving the 7.5 ohm alone) and see how that sounds.
Comments
8 coats of lacquer and I'm calling these cabinets done. Tomorrow I'll install all the drivers and see what they sound like in stereo. So far, I've only listened to one speaker playing mostly test tones.
How many coats did the Yota get?😛
Nice classic Tercell in the background")
Yota got 8 coats as well. Yota needs a bath!!
Time to sell. I'm happy to take it off your hands.
Is there some kind of a niche collectable value for old Toyotas like Beetles or Yugo's?
1991 Tercel. No rust. 74k miles. Single owner (me). Purchased new in 1991 for $7700. Almost all miles are long trips (200 to 350 miles). Has original brake pads front and rear, which are almost new in appearance. Gets 35mpg on average and up to 40mpg on long trips. Car just sits in garage all winter; I take it out for a few joy rides each summer. I keep fresh oil in the crankcase at all times to prevent sludge buildup. I keep STA-BIL in the gas tank at all times. I keep the gas tank completely full and always put a bottle of ISO-HEAT in the gas tank over the winter months.
But sorry, John, not for sale. This is my backup car. I keep it licensed and insured 24/7/365. It is ready to go at all times (just put a new battery in it). If something goes wrong with my main car, I need to be able to jump into the backup and go.
There probably is, but I have not checked into it. In Wisconsin, I can switch over to "collector car" licensing, but it is a huge one time payment with driving restrictions. For instance, you cannot operate a collector car on the highways during the month of January. Which would completely defeat my purpose of having an "always-ready-to-go" backup car.
In terms of value, the kelly blue book on this vehicle is probably "salvage." But if I had to replace this vehicle, that is the true value to me. All the major car companies have eliminated their <$20k vehicles (Hundai Accent, Chevy Spark, Nissan Virsa, Honda Civic, etc). The only <$20k vehicle left is the Mitsubishi Mirage, a 3 cyclinder with good mpg but no power. The 100% electric vehicles have limited range and cost way too much. And the hybrid electric vehicles cost way too much as well.
Dang, have you tried Uber?")
No. What if it takes me several weeks or even months to repair or replace my main vehicle? I want to be able to take my good natured time to decide what to do. And to go parts chasing multiple times if necessary. Having a backup vehicle that can be used for several weeks or months solves that problem. Uber would be a royal pain in the rear end, forcing me to make a quick decision to buy a new car that I don't really want.
OT rant ahead ...
The turdcel brings back bad memories for me.
In 40 years of driving, this is the only vehicle that had a catastrophic motor loss. We were commuting out of state for medical treatment for boy, and the motor started hammering. At the time, we couldn't afford to buy a handful of dirt and this 'Toyota's are indestructible' let us down. Pulled the motor out of a salvage vehicle and did the motor swap myself.
40k on the odo. Years later, we found out Toyota had an 'oil sludge' lawsuit on that motor. Allegedly, sludge would build up in the down spout from the head to the pan causing oil starvation.
FWIW, the old brown mule 'truck' has 240k, the suby has 180k, and the old Ranger gt had 260k when it was parked.
Never owned another Toyota. Never will.
Just another Toyolet") I think I'll try a Korean car when my pos Nissan Altiturd is too costly or painful for me to repair myself. What a cheap ass design/build. Great mpg but that's about it. No wonder they have such a terrible resale value.
I think I'll try a Korean car when my pos Nissan Altiturd is too costly or painful for me to repair myself. What a cheap ass design/build. Great mpg but that's about it. No wonder they have such a terrible resale value.
My previous car (before the Tercel) was a 1983 Toyota Starlet. It had 324,000+ miles on it when I pulled into the Nissan dealer and traded it off for my current Nissan Versa (2010). Engine still ran good, did not burn oil, but the car body was totally rusted out along the wheel wells and was in real danger of structural collapse. My co-workers called it the "harlot".
Changed oil/filter once per year. Pulled the transmission out myself two or three times, replaced input shaft, front main bearing, and seal. Replaced clutch, throw out bearing, and pressure plate once. Replaced alternator two or three times. Replaced thermostat several times. Replaced drive shaft U-joints two or three times (this was rear wheel drive). Replaced front and rear brake pads several times, replaced front rotors once. Replaced entire exhaust system several times. Car was alot of work to keep on the road, but very dependable, one of the best cars I have ever had. Got 44mpg on the highway. Very small car, easy to park and see out the huge rear window when backing up (unlike cars today, which have very small rear windows and therefore need rear cameras to see what is behind you).
I ran up a complete set of spinorama measurements on the completed speaker. I used the same speaker that was used to create the VituixCAD model. All FR measurements were taken using the calibrated Sonarworks SoundID mic, dual channel Arta jig, and Soundeasy v20 (Easylab). Z measurements were taken with DATS V2. Here are some graphs showing how the model compares to the final measurements:
Axial FR modelled vs. measured. In Room FR modelled vs measured (offset 5dB for clarity)
Listening Window FR modelled vs measured. Power Resp modelled vs. measured (offset 5dB for clarity)
Modelled vs final measured impedance curve:
so your final Xover points ~600 and 2500 ?
SoundEasy, DATS, VituixCAD, then displayed in Omnimic. You've got to throw ARTA into the mix somewhere just so you can utilize every software package you have")
I would say your measurements have great agreement apart from 500-1kHz. FWIW If I take your "final" crossover posted here and apply it to the data I have for your drivers, I arrive at something that matches closely with your measurements, with a bit of a lump from 500Hz to 1kHz, but with 2dB difference in the low end. I would suspect the "error" lies in how the woofer response was re-processed, or simply in how the near and far field responses were spliced. The impedance difference around the same area might also indicate some error in part value in the woofer crossover, changing the 1.5ohm resistor to 2.2 ohm in the simulation creates about the same change to overall impedance, and creates a more "peaky" woofer response in that same frequency range.
For comparison, I simply traced your above on-axis measurement and compared to the simulation using the response data I have for your drivers (adjusted to 1m distance), and the final crossover as you posted. Orange dashed line is your measured response above.
Regardless, if you are happy with the sound of the speaker, that's what really matters. Enjoy!
Just another comparison to see whats the smallest change I can make for simulation to match your measurement. Adjusted woofer up by 2.5dB, and changed 1.5ohm to 2.2ohm in the woofer circuit. Hopefully this is helpful to nail down the difference between your sim and reality.
My guesstimate would be 650 and 3500, depending on how you want to interpret the graphs. The mid has kind of a funny looking shelf in the 2.5-4k region, which makes it difficult to really say where the upper crossover point is happening. Target curve overlays would probably help me to see this a little bit better, but I have not done this.
I think I know what is happening. When I merged NF woofer + diffraction model + FF woofer files, I applied 4dB (not 6dB) of BSC in the diffraction model. I did this to account for the fact that my woofers will be 17" (on center) from the floor. This proximity to the floor will boost the lower mid bass frequencies somewhat and I wanted to account for this in the model. So, in order to make this adjustment, I changed the "Axis distance" from 2500mm down to 600mm. This reduced the baffle step applied by 2dB. I did not enter anything in the floor or wall reflection fields, because those field only affect the response above 1kHz. I didn't care about the response above 1kHz, because that was being replaced by the FF woofer data. Only the change in the slope of the response below 1kHz was important for the model.
Also, this might have something to do with the 500-1kHz disagreement of the model verses my measurements. Not sure about that.
Also, when I did the final spinorama measurements, the microphone was 1 meter on axis to the tweeter for all measurements. The microphone was 72.5" above the floor for all measurements, so I was able to use a gate of 8.1ms. When I set up the original model, the drivers were each measured 1 meter on axis, but the distance from mic to floor varied, so I had to use a much shorter gate (approx 4.7ms).
Gate difference is okay and would be a very minor difference if any as long as nearfield and splice is done correctly for a reflection free response. For the comparisons I made above, all I did was adjust the listening distance to 1m and use the same response files that I generated from the raw measurements that you posted.
You can do the same, just right click on the SPL graph and "open overlay". You can hold shift and use the scroll wheel to adjust the SPL of the loaded overlay to get a perfect overlap.
I just pulled the woofer out and double checked the 1.5 ohm resistor. It measures exactly 1.51 ohms on my ExTech meter (1.67 - 0.16 lead resistance). So the difference is probably due to NF/FF/Diff splicing error. I'll re-do my model splicing and see if that makes a difference.
The suggestion for the 1.5 ohm resistor was based on your measured impedance vs sim. Could be the 120uF cap causing that error as well, but adjusting the resistor up to 2.2 ohm gave better agreement with your measurement, both in impedance and frequency response.
Focusing on impedance, comparison of 1.5 vs 2.2 ohm.
Comparison of 120uF vs 100uF, I think you can agree the resistor change looks more like your measurement.
Thanks, dcibel. Your analysis seems to fit the data well. I was thinking this over, and it seems to me that my modeled and measured curves should match perfectly below 400Hz, since both curves are the product of the same diffraction model. It looks like I messed up my comparison curves above, because I was assuming that my overall modeled and measured SPL levels were the same. But they were not. If you look closely at my posted comparison curves, it looks like my modeled curves have an overall 1dB higher SPL compared to my measured curves. Will fix and re-post them tomorrow morning.
So, how do they sound?
The overall tonal balance is thick and heavy with lots of bass. This is with them mounted on my short stands (woofers 17" on center above the floor). I think I need to reduce the amount of bass below 400Hz or so. Sounds like I did not apply the correct amount of baffle step compensation, compared to many of my other speakers, which sound much more balanced.
Here are the revised comparison curves. I adjusted the modelled curves down by 0.8dB, which results in an almost perfect match between modelled and measured below 400Hz. In looking at the 400-900Hz region, I was thinking that perhaps this difference is due to my using the wrong splicing frequency when I merged the NF/FF/Diff curves. I spliced at 400Hz. Maybe I should have spliced at about 650Hz. This higher splice frequency would have forced the two curves to match much better throughout the 400-900Hz region. Perhaps this is why they now sound a little bass heavy, because this very low splicing frequency pushed the low frequencies down too far in my model. Seems logical. Just speculating.
If you feel the sound as-is is a bit too bloated, here's what I would try:
-the 1.5 ohm resistor in the midrange circuit, remove it or just short it out.
-the 7.5 ohm resistor in the tweeter circuit is increased to 15 ohms
This change will lift everything >1kHz by about 2dB. Here's the before/after of the change (1m listening distance sim to match above comparison).
I did a comparison of a 400Hz splicing model verses a 650Hz splicing model. This produces an approx 2dB SPL change at 100Hz in the model. So, it looks like splicing at the appropriate frequency is critical when setting up your initial diffraction model.
400Hz model:
650Hz model:
Thanks for the suggestions. I snipped out the 1.5 ohm on the midrange and now the mids sound about right (Edit: poorly worded. Actually, I shorted out the 1.5 ohm resistor on the midrange). I paralleled a 10 ohm across the tweeter's 4 ohm series resistor and the extreme highs were just a tad too bright (splashy, sibilant). I will try replacing the 7.5 ohm with 15 to see how that sounds. Will also try a 15 ohm paralleled across the 4 ohm (leaving the 7.5 ohm alone) and see how that sounds.